Pizza Hut 2009 Annual Report Download - page 123
Download and view the complete annual report
Please find page 123 of the 2009 Pizza Hut annual report below. You can navigate through the pages in the report by either clicking on the pages listed below, or by using the keyword search tool below to find specific information within the annual report.-
 1
1 -
2
-
3
-
4
-
5
-
6
-
7
-
8
-
9
-
10
-
11
-
12
-
13
-
14
-
15
-
16
-
17
-
18
-
19
-
20
-
21
-
22
-
23
-
24
-
25
-
26
-
27
-
28
-
29
-
30
-
31
-
32
-
33
-
34
-
35
-
36
-
37
-
38
-
39
-
40
-
41
-
42
-
43
-
44
-
45
-
46
-
47
-
48
-
49
-
50
-
51
-
52
-
53
-
54
-
55
-
56
-
57
-
58
-
59
-
60
-
61
-
62
-
63
-
64
-
65
-
66
-
67
-
68
-
69
-
70
-
71
-
72
-
73
-
74
-
75
-
76
-
77
-
78
-
79
-
80
-
81
-
82
-
83
-
84
-
85
-
86
-
87
-
88
-
89
-
90
-
91
-
92
-
93
-
94
-
95
-
96
-
97
-
98
-
99
-
100
-
101
-
102
-
103
-
104
-
105
-
106
-
107
-
108
-
109
-
110
-
111
-
112
-
 113
113 -
 114
114 -
 115
115 -
 116
116 -
 117
117 -
 118
118 -
 119
119 -
 120
120 -
 121
121 -
 122
122 -
 123
123 -
 124
124 -
 125
125 -
 126
126 -
 127
127 -
 128
128 -
 129
129 -
 130
130 -
 131
131 -
 132
132 -
 133
133 -
134
-
135
-
136
-
137
-
138
-
139
-
140
-
141
-
142
-
143
-
144
-
145
-
146
-
147
-
148
-
149
-
150
-
151
-
152
-
153
-
154
-
155
-
156
-
157
-
158
-
159
-
160
-
161
-
162
-
163
-
164
-
165
-
166
-
167
-
168
-
169
-
170
-
171
-
172
-
173
-
174
-
175
-
176
-
177
-
178
-
179
-
180
-
181
-
182
-
183
-
184
-
185
-
186
-
187
-
188
-
189
-
190
-
191
-
192
-
193
-
194
-
195
-
196
-
197
-
198
-
199
-
200
-
201
-
202
-
203
-
204
-
205
-
206
-
207
-
208
-
209
-
210
-
211
-
212
-
213
-
214
-
215
-
216
-
217
-
218
-
219
-
220
 |
 |

32
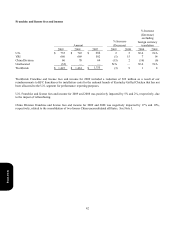
Restaurant Profit
The U.S. restaurant margin increased 1.4 percentage points in 2009. This increase was largely driven by commodity
deflation of $28 million and productivity initiatives partially offset by Company same store sales declines of 4%.
Additionally, our U.S. store portfolio actions, including the refranchising of 541 stores during 2009, positively impacted
our restaurant margin by 0.4 percentage points.
Our U.S. restaurant margin decreased 0.8 percentage points in 2008. Restaurant profit was negatively impacted by $119
million of commodity inflation for the full year 2008. Additionally, restaurant profit in 2008 was negatively impacted by
$30 million due to higher property and casualty self-insurance expense, exclusive of the estimated reduction due to
refranchised stores, as we lapped favorability in 2007. These decreases were partially offset by Company same store sales
growth of 3% resulting from pricing actions we took.
China Division restaurant margin increased 1.8 percentage points and declined 1.7 percentage points in 2009 and 2008,
respectively. The 2009 improvement was largely driven by commodity deflation of $61 million offsetting Company same
store sales declines 1%. Commodity inflation of $78 million and higher labor costs partially offset by Company same
store sales growth of 7% drove the 2008 restaurant margin decline.
Form 10-K