Pizza Hut 2009 Annual Report Download - page 181
Download and view the complete annual report
Please find page 181 of the 2009 Pizza Hut annual report below. You can navigate through the pages in the report by either clicking on the pages listed below, or by using the keyword search tool below to find specific information within the annual report.-
 1
1 -
2
-
3
-
4
-
5
-
6
-
7
-
8
-
9
-
10
-
11
-
12
-
13
-
14
-
15
-
16
-
17
-
18
-
19
-
20
-
21
-
22
-
23
-
24
-
25
-
26
-
27
-
28
-
29
-
30
-
31
-
32
-
33
-
34
-
35
-
36
-
37
-
38
-
39
-
40
-
41
-
42
-
43
-
44
-
45
-
46
-
47
-
48
-
49
-
50
-
51
-
52
-
53
-
54
-
55
-
56
-
57
-
58
-
59
-
60
-
61
-
62
-
63
-
64
-
65
-
66
-
67
-
68
-
69
-
70
-
71
-
72
-
73
-
74
-
75
-
76
-
77
-
78
-
79
-
80
-
81
-
82
-
83
-
84
-
85
-
86
-
87
-
88
-
89
-
90
-
91
-
92
-
93
-
94
-
95
-
96
-
97
-
98
-
99
-
100
-
101
-
102
-
103
-
104
-
105
-
106
-
107
-
108
-
109
-
110
-
111
-
112
-
113
-
114
-
115
-
116
-
117
-
118
-
119
-
120
-
121
-
122
-
123
-
124
-
125
-
126
-
127
-
128
-
129
-
130
-
131
-
132
-
133
-
134
-
135
-
136
-
137
-
138
-
139
-
140
-
141
-
142
-
143
-
144
-
145
-
146
-
147
-
148
-
149
-
150
-
151
-
152
-
153
-
154
-
155
-
156
-
157
-
158
-
159
-
160
-
161
-
162
-
163
-
164
-
165
-
166
-
167
-
168
-
169
-
170
-
 171
171 -
 172
172 -
 173
173 -
 174
174 -
 175
175 -
 176
176 -
 177
177 -
 178
178 -
 179
179 -
 180
180 -
 181
181 -
 182
182 -
 183
183 -
 184
184 -
 185
185 -
 186
186 -
 187
187 -
 188
188 -
 189
189 -
 190
190 -
 191
191 -
192
-
193
-
194
-
195
-
196
-
197
-
198
-
199
-
200
-
201
-
202
-
203
-
204
-
205
-
206
-
207
-
208
-
209
-
210
-
211
-
212
-
213
-
214
-
215
-
216
-
217
-
218
-
219
-
220
 |
 |

90
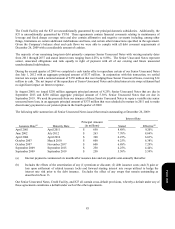
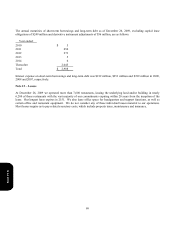
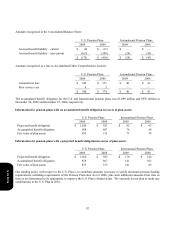
The following table presents the fair values for those assets and liabilities measured at fair value during 2009 on a non-
recurring basis, and remaining on our Consolidated Balance Sheet as of December 26, 2009. Total losses include losses
recognized from all non-recurring fair value measurements during the year ended December 26, 2009:
Fair Value Measurements Using Total Losses
Description
As of
December 26, 2009 Level 1 Level 2 Level 3
2009
Long-lived assets held for use
$ 30 $
—
$
—
$ 30 $ 56
Goodwill
—
—
—
—
38
Long-lived assets held for use presented in the table above include restaurants or groups of restaurants that were impaired
as a result of our semi-annual impairment review or restaurants not meeting held for sale criteria that have been offered
for sale at a price less than their carrying value during the year ended December 26, 2009. Of the $56 million in
impairment charges shown in the table above for the year ended December 26, 2009, $20 million was included in
Refranchising (gain) loss and $36 million was included in Closures and impairment (income) expenses in the
Consolidated Statements of Income.
Goodwill in the table above includes the goodwill impairment charges for our Pizza Hut South Korea and LJS/A&W-U.S.
reporting units, which are discussed in Note 10. These impairment charges were recorded in Closures and impairment
(income) expenses in the Consolidated Statements of Income.
At December 26, 2009 the carrying values of cash and cash equivalents, accounts receivable and accounts payable
approximated their fair values because of the short-term nature of these instruments. The fair value of notes receivable
net of allowances and lease guarantees less subsequent amortization approximates their carrying value. The Company’s
debt obligations, excluding capital leases, were estimated to have a fair value of $3.3 billion, compared to their carrying
value of $3 billion. We estimated the fair value of debt using market quotes and calculations based on market rates.
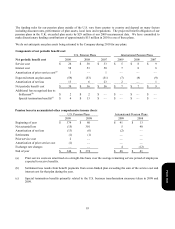
Note 15 – Pension and Post-retirement Medical Benefits
Pension Benefits.
We sponsor noncontributory defined benefit pension plans covering certain full-time salaried and
hourly U.S. employees. The most significant of these plans, the YUM Retirement Plan (the “Plan”), is funded while
benefits from the other U.S. plans are paid by the Company as incurred. During 2001, the plans covering our U.S.
salaried employees were amended such that any salaried employee hired or rehired by YUM after September 30, 2001 is
not eligible to participate in those plans. Benefits are based on years of service and earnings or stated amounts for each
year of service. We also sponsor various defined benefit pension plans covering certain of our non-U.S. employees, the
most significant of which are in the U.K. Our plans in the U.K. have previously been amended such that new employees
are not eligible to participate in these plans.
Form 10-K