Pizza Hut 2009 Annual Report Download - page 119
Download and view the complete annual report
Please find page 119 of the 2009 Pizza Hut annual report below. You can navigate through the pages in the report by either clicking on the pages listed below, or by using the keyword search tool below to find specific information within the annual report.-
 1
1 -
2
-
3
-
4
-
5
-
6
-
7
-
8
-
9
-
10
-
11
-
12
-
13
-
14
-
15
-
16
-
17
-
18
-
19
-
20
-
21
-
22
-
23
-
24
-
25
-
26
-
27
-
28
-
29
-
30
-
31
-
32
-
33
-
34
-
35
-
36
-
37
-
38
-
39
-
40
-
41
-
42
-
43
-
44
-
45
-
46
-
47
-
48
-
49
-
50
-
51
-
52
-
53
-
54
-
55
-
56
-
57
-
58
-
59
-
60
-
61
-
62
-
63
-
64
-
65
-
66
-
67
-
68
-
69
-
70
-
71
-
72
-
73
-
74
-
75
-
76
-
77
-
78
-
79
-
80
-
81
-
82
-
83
-
84
-
85
-
86
-
87
-
88
-
89
-
90
-
91
-
92
-
93
-
94
-
95
-
96
-
97
-
98
-
99
-
100
-
101
-
102
-
103
-
104
-
105
-
106
-
107
-
108
-
 109
109 -
 110
110 -
 111
111 -
 112
112 -
 113
113 -
 114
114 -
 115
115 -
 116
116 -
 117
117 -
 118
118 -
 119
119 -
 120
120 -
 121
121 -
 122
122 -
 123
123 -
 124
124 -
 125
125 -
 126
126 -
 127
127 -
 128
128 -
 129
129 -
130
-
131
-
132
-
133
-
134
-
135
-
136
-
137
-
138
-
139
-
140
-
141
-
142
-
143
-
144
-
145
-
146
-
147
-
148
-
149
-
150
-
151
-
152
-
153
-
154
-
155
-
156
-
157
-
158
-
159
-
160
-
161
-
162
-
163
-
164
-
165
-
166
-
167
-
168
-
169
-
170
-
171
-
172
-
173
-
174
-
175
-
176
-
177
-
178
-
179
-
180
-
181
-
182
-
183
-
184
-
185
-
186
-
187
-
188
-
189
-
190
-
191
-
192
-
193
-
194
-
195
-
196
-
197
-
198
-
199
-
200
-
201
-
202
-
203
-
204
-
205
-
206
-
207
-
208
-
209
-
210
-
211
-
212
-
213
-
214
-
215
-
216
-
217
-
218
-
219
-
220
 |
 |

28
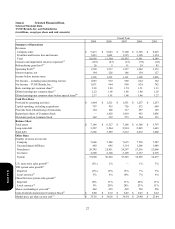
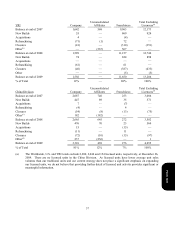
Results of Operations
Amount
% B/(W)
2009 2008 2007 2009 2008
Company sales
$
9,413
$
9,843
$
9,100 (4
)
8
Franchise and license fees and income 1,423 1,461 1,335 (3
)
9
Total revenues
$
10,836
$
11,304
$
10,435 (4
)
8
Company restaurant profit
$
1,479
$
1,378
$
1,327 7 4
% of Company sales 15.7% 14.0% 14.6% 1.7 ppts. (0.6
)
ppts.
Operating Profit 1,590 1,517 1,357 5 12
Interest expense, net 194 226 166 14 (36
)
Income tax provision 313 319 282 2
(13
)
Net Income – including noncontrolling interest 1,083 972 909 11 7
Net Income – noncontrolling interest 12 8 — NM NM
N
et Income – YUM! Brands, Inc.
$
1,071
$
964
$
909 11 6
Diluted EPS(a)
$
2.22
$
1.96
$
1.68 13 17
Diluted EPS before Special Items(a)
$
2.17
$
1.91
$
1.68 13 14
Effective tax rate 22.4% 24.7% 23.7%
(a) See Note 4 for the number of shares used in these calculations.
Significant Known Events, Trends or Uncertainties Impacting or Expected to Impact Comparisons of Reported or
Future Results
Special Items
In addition to the results provided in accordance with U.S. Generally Accepted Accounting Principles (“GAAP”) above
and throughout this document, the Company has provided non-GAAP measurements which present operating results in
2009 and 2008 on a basis before Special Items. Included in Special Items are the impact of measures we took to
transform our U.S. business (“the U.S. business transformation measures”) including: the U.S. refranchising (gain) loss,
charges relating to U.S. General and Administrative (“G&A”) productivity initiatives and realignment of resources,
investments in our U.S. Brands and a 2009 U.S. Goodwill impairment charge. Special items also include the 2009 loss
recognized as a result of our decision to offer to refranchise an equity market outside the U.S., the 2009 gain upon our
acquisition of additional ownership in, and consolidation of, the operating entity that owns the KFCs in Shanghai, China,
and the 2008 gain on the sale of our minority interest in our Japan unconsolidated affiliate. These amounts are further
described below.
Form 10-K