Pizza Hut 2009 Annual Report Download - page 206
Download and view the complete annual report
Please find page 206 of the 2009 Pizza Hut annual report below. You can navigate through the pages in the report by either clicking on the pages listed below, or by using the keyword search tool below to find specific information within the annual report.-
 1
1 -
2
-
3
-
4
-
5
-
6
-
7
-
8
-
9
-
10
-
11
-
12
-
13
-
14
-
15
-
16
-
17
-
18
-
19
-
20
-
21
-
22
-
23
-
24
-
25
-
26
-
27
-
28
-
29
-
30
-
31
-
32
-
33
-
34
-
35
-
36
-
37
-
38
-
39
-
40
-
41
-
42
-
43
-
44
-
45
-
46
-
47
-
48
-
49
-
50
-
51
-
52
-
53
-
54
-
55
-
56
-
57
-
58
-
59
-
60
-
61
-
62
-
63
-
64
-
65
-
66
-
67
-
68
-
69
-
70
-
71
-
72
-
73
-
74
-
75
-
76
-
77
-
78
-
79
-
80
-
81
-
82
-
83
-
84
-
85
-
86
-
87
-
88
-
89
-
90
-
91
-
92
-
93
-
94
-
95
-
96
-
97
-
98
-
99
-
100
-
101
-
102
-
103
-
104
-
105
-
106
-
107
-
108
-
109
-
110
-
111
-
112
-
113
-
114
-
115
-
116
-
117
-
118
-
119
-
120
-
121
-
122
-
123
-
124
-
125
-
126
-
127
-
128
-
129
-
130
-
131
-
132
-
133
-
134
-
135
-
136
-
137
-
138
-
139
-
140
-
141
-
142
-
143
-
144
-
145
-
146
-
147
-
148
-
149
-
150
-
151
-
152
-
153
-
154
-
155
-
156
-
157
-
158
-
159
-
160
-
161
-
162
-
163
-
164
-
165
-
166
-
167
-
168
-
169
-
170
-
171
-
172
-
173
-
174
-
175
-
176
-
177
-
178
-
179
-
180
-
181
-
182
-
183
-
184
-
185
-
186
-
187
-
188
-
189
-
190
-
191
-
192
-
193
-
194
-
195
-
 196
196 -
 197
197 -
 198
198 -
 199
199 -
 200
200 -
 201
201 -
 202
202 -
 203
203 -
 204
204 -
 205
205 -
 206
206 -
 207
207 -
 208
208 -
 209
209 -
 210
210 -
 211
211 -
 212
212 -
 213
213 -
 214
214 -
 215
215 -
 216
216 -
217
-
218
-
219
-
220
 |
 |

115
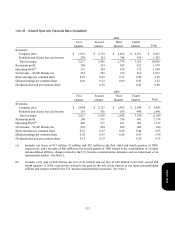
Note 22 – Selected Quarterly Financial Data (Unaudited)
2009
First
Quarter
Second
Quarter
Third
Quarter
Fourth
Quarter
Total
Revenues:
Company sales $ 1,918 $ 2,152 $ 2,432 $ 2,911 $ 9,413
Franchise and license fees and income 299 324 346 454 1,423
Total revenues 2,217 2,476 2,778 3,365 10,836
Restaurant profit 308 324 425 422 1,479
Operating Profit(a) 351 394 470 375 1,590
N
et Income – YUM! Brands, Inc. 218 303 334 216 1,071
Basic earnings per common share 0.47 0.65 0.71 0.46 2.28
Diluted earnings per common share 0.46 0.63 0.69 0.45 2.22
Dividends declared per common share — 0.38 — 0.42 0.80
2008
First
Quarter
Second
Quarter
Third
Quarter
Fourth
Quarter
Total
Revenues:
Company sales $ 2,094 $ 2,323 $ 2,482 $ 2,944 $ 9,843
Franchise and license fees and income 319 336 360 446 1,461
Total revenues 2,413 2,659 2,842 3,390 11,304
Restaurant profit 308 311 358 401 1,378
Operating Profit(b) 426 317 411 363 1,517
N
et Income – YUM! Brands, Inc. 254 224 282 204 964
Basic earnings per common share 0.52 0.47 0.60 0.44 2.03
Diluted earnings per common share 0.50 0.45 0.58 0.43 1.96
Dividends declared per common share 0.15 0.19 — 0.38 0.72
(a)
I
ncludes net losses of $17 million, $3 million and $22 million in the first, third and fourth quarters of 2009,
respectively, and a net gain of $60 million in the second quarter of 2009 related to the consolidation of a former
unconsolidated affiliate, charges related to the U.S. business transformation measures and an impairment of an
i
nternational market. See Note 5.
(b)
I
ncludes a net gain of $68 million, net loss of $3 million and net loss of $26 million in the first, second and
fourth quarters of 2008, respectively, related to the gain on the sale of our interest in our Japan unconsolidated
a
ffiliate and charges related to the U.S. business transformation measures. See Note 5.
Form 10-K