Pizza Hut 2009 Annual Report Download - page 55
Download and view the complete annual report
Please find page 55 of the 2009 Pizza Hut annual report below. You can navigate through the pages in the report by either clicking on the pages listed below, or by using the keyword search tool below to find specific information within the annual report.-
 1
1 -
2
-
3
-
4
-
5
-
6
-
7
-
8
-
9
-
10
-
11
-
12
-
13
-
14
-
15
-
16
-
17
-
18
-
19
-
20
-
21
-
22
-
23
-
24
-
25
-
26
-
27
-
28
-
29
-
30
-
31
-
32
-
33
-
34
-
35
-
36
-
37
-
38
-
39
-
40
-
41
-
42
-
43
-
44
-
 45
45 -
 46
46 -
 47
47 -
 48
48 -
 49
49 -
 50
50 -
 51
51 -
 52
52 -
 53
53 -
 54
54 -
 55
55 -
 56
56 -
 57
57 -
 58
58 -
 59
59 -
 60
60 -
 61
61 -
 62
62 -
 63
63 -
 64
64 -
 65
65 -
66
-
67
-
68
-
69
-
70
-
71
-
72
-
73
-
74
-
75
-
76
-
77
-
78
-
79
-
80
-
81
-
82
-
83
-
84
-
85
-
86
-
87
-
88
-
89
-
90
-
91
-
92
-
93
-
94
-
95
-
96
-
97
-
98
-
99
-
100
-
101
-
102
-
103
-
104
-
105
-
106
-
107
-
108
-
109
-
110
-
111
-
112
-
113
-
114
-
115
-
116
-
117
-
118
-
119
-
120
-
121
-
122
-
123
-
124
-
125
-
126
-
127
-
128
-
129
-
130
-
131
-
132
-
133
-
134
-
135
-
136
-
137
-
138
-
139
-
140
-
141
-
142
-
143
-
144
-
145
-
146
-
147
-
148
-
149
-
150
-
151
-
152
-
153
-
154
-
155
-
156
-
157
-
158
-
159
-
160
-
161
-
162
-
163
-
164
-
165
-
166
-
167
-
168
-
169
-
170
-
171
-
172
-
173
-
174
-
175
-
176
-
177
-
178
-
179
-
180
-
181
-
182
-
183
-
184
-
185
-
186
-
187
-
188
-
189
-
190
-
191
-
192
-
193
-
194
-
195
-
196
-
197
-
198
-
199
-
200
-
201
-
202
-
203
-
204
-
205
-
206
-
207
-
208
-
209
-
210
-
211
-
212
-
213
-
214
-
215
-
216
-
217
-
218
-
219
-
220
 |
 |

21MAR201012032309
At the end of 2009, the Company incurred a charge for impairment of goodwill in a YRI market. The
Committee decided to exclude this charge from YRI’s 2009 team performance factor calculation because it
arose from multiple years of poor performance in the market and is not indicative of YRI’s 2009 operating
performance. Had this charge been reflected in the YRI 2009 team performance factor, the blended YRI/
YUM team performance factor would have been 19 points lower and the YUM team performance factor
would have been 6 points lower.
Individual Performance Factor. Each NEOs Individual Performance Factor is determined by the
Committee based upon their subjective determination of the NEOs individual performance for the year,
including consideration of specific objective individual performance goals set at the beginning of the year.
As described above, the CEO provides the Committee with his evaluation of each of the other NEOs’
performance and recommends an Individual Performance Factor to the Committee.
For Mr. Carucci, the Committee determined that his overall individual performance for 2009 was
above target based upon strong financial results of the Company, net new restaurants and significant G&A
savings. Based on this performance, the Committee approved a 135 Individual Performance Factor for
Mr. Carucci.
For Mr. Su, the Committee determined that his overall individual performance for 2009 was
significantly above target based upon the China Division significantly exceeding its profit and development
plans, and maintaining positive sales growth in a tough economic environment. Based on this performance,
the Committee approved a 140 Individual Performance Factor for Mr. Su.
For Mr. Allan, the Committee determined that his overall individual performance for 2009 was above
target based upon the International Division’s continued strong development and customer service
measures, as well as Mr. Allan’s strong leadership in maintaining positive system sales growth in a tough
economic environment. Based on this performance, the committee approved a 130 Individual Performance
Factor for Mr. Allan.
For Mr. Creed, the Committee determined that his overall individual performance for 2009 was above
target based upon Taco Bell US exceeding its profit plan, restaurant margin and customer service targets as
well as Mr. Creed’s strong leadership in driving product development. Based on this performance, the
Proxy Statement
Committee approved a 135 Individual Performance Factor for Mr. Creed.
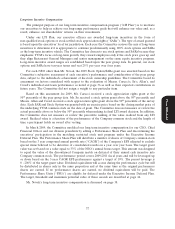
Application of Annual Incentive Program Formula to NEOs
Based on the Committee’s determinations as described above, the following table sets forth the
annual incentive formula and the calculation of annual incentive for each NEO.
Individual
Annual Bonus Team Performance Performance
Formula: Base Salary ⍥Target % ⍥Factor ⍥Factor = Bonus Award
Minimum—0% Minimum—0% Minimum—0%
Maximum—200% Maximum—150% Maximum—300%
Novak $1,400,000 ǂ160% ǂ99% ǂ135% = $2,993,760
Carucci $715,000 ǂ95% ǂ99% ǂ135% = $907,818
Su $815,000 ǂ115% ǂ131% ǂ140% = $1,718,917
Allan $815,000 ǂ115% ǂ84% ǂ130% = $1,023,477
Creed $650,000 ǂ90% ǂ126% ǂ135% = $995,085
Note: Messrs. Allan, Su and Creed’s team performance factor is based on 75% of their Division team
performance factor and 25% of the consolidated team performance factor. Mr. Novak’s performance is
discussed beginning on page 38.
36