Pizza Hut 2009 Annual Report Download - page 125
Download and view the complete annual report
Please find page 125 of the 2009 Pizza Hut annual report below. You can navigate through the pages in the report by either clicking on the pages listed below, or by using the keyword search tool below to find specific information within the annual report.-
 1
1 -
2
-
3
-
4
-
5
-
6
-
7
-
8
-
9
-
10
-
11
-
12
-
13
-
14
-
15
-
16
-
17
-
18
-
19
-
20
-
21
-
22
-
23
-
24
-
25
-
26
-
27
-
28
-
29
-
30
-
31
-
32
-
33
-
34
-
35
-
36
-
37
-
38
-
39
-
40
-
41
-
42
-
43
-
44
-
45
-
46
-
47
-
48
-
49
-
50
-
51
-
52
-
53
-
54
-
55
-
56
-
57
-
58
-
59
-
60
-
61
-
62
-
63
-
64
-
65
-
66
-
67
-
68
-
69
-
70
-
71
-
72
-
73
-
74
-
75
-
76
-
77
-
78
-
79
-
80
-
81
-
82
-
83
-
84
-
85
-
86
-
87
-
88
-
89
-
90
-
91
-
92
-
93
-
94
-
95
-
96
-
97
-
98
-
99
-
100
-
101
-
102
-
103
-
104
-
105
-
106
-
107
-
108
-
109
-
110
-
111
-
112
-
113
-
114
-
 115
115 -
 116
116 -
 117
117 -
 118
118 -
 119
119 -
 120
120 -
 121
121 -
 122
122 -
 123
123 -
 124
124 -
 125
125 -
 126
126 -
 127
127 -
 128
128 -
 129
129 -
 130
130 -
 131
131 -
 132
132 -
 133
133 -
 134
134 -
 135
135 -
136
-
137
-
138
-
139
-
140
-
141
-
142
-
143
-
144
-
145
-
146
-
147
-
148
-
149
-
150
-
151
-
152
-
153
-
154
-
155
-
156
-
157
-
158
-
159
-
160
-
161
-
162
-
163
-
164
-
165
-
166
-
167
-
168
-
169
-
170
-
171
-
172
-
173
-
174
-
175
-
176
-
177
-
178
-
179
-
180
-
181
-
182
-
183
-
184
-
185
-
186
-
187
-
188
-
189
-
190
-
191
-
192
-
193
-
194
-
195
-
196
-
197
-
198
-
199
-
200
-
201
-
202
-
203
-
204
-
205
-
206
-
207
-
208
-
209
-
210
-
211
-
212
-
213
-
214
-
215
-
216
-
217
-
218
-
219
-
220
 |
 |

34
Mexico Value Added Tax (“VAT”) Exemption
On October 1, 2007, Mexico enacted new legislation that eliminated a tax ruling that allowed us to claim an exemption
related to VAT payments. Beginning on January 1, 2008, we were required to remit VAT on all Company restaurant sales
resulting in lower Company sales and Restaurant profit. As a result of this new legislation, our International Division’s
Company sales and Restaurant profit for the year ended December 27, 2008 were unfavorably impacted by approximately
$38 million and $34 million, respectively. The International Division’s system sales growth and restaurant margin as a
percentage of sales were negatively impacted by approximately 0.3 and 1.2 percentage points, respectively, for the year
ended December 27, 2008. The 2009 impact versus 2008 was not significant to our International Division’s results of
operations.
Tax Legislation – Mainland China
On March 16, 2007, the National People’s Congress in mainland China enacted new tax legislation that went into effect
on January 1, 2008. Upon enactment, which occurred in the China Division’s 2007 second fiscal quarter, the deferred tax
balances of all Chinese entities, including our unconsolidated affiliates, were adjusted. These income tax rate changes
positively impacted our 2009 and 2008 Net Income – YUM! Brands, Inc. by approximately $15 million and $20 million,
respectively, compared to what it would have otherwise been had no new tax legislation been enacted. The impacts on
our Income tax provision and Operating Profit in the year ended December 29, 2007 were not significant.
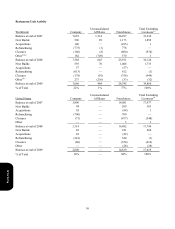
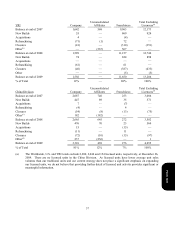
Store Portfolio Strategy
From time to time we sell Company restaurants to existing and new franchisees where geographic synergies can be
obtained or where franchisees’ expertise can generally be leveraged to improve our overall operating performance, while
retaining Company ownership of strategic U.S. and international markets. In the U.S., we are targeting Company
ownership of restaurants potentially below 10%, down from its current level of 16%. Consistent with this strategy, 541,
700 and 304 Company restaurants in the U.S. were sold to franchisees in the years ended December 26, 2009, December
27, 2008 and December 29, 2007, respectively.
Refranchisings reduce our reported revenues and restaurant profits and increase the importance of system sales growth as
a key performance measure. Additionally, G&A expenses will decline over time as a result of these refranchising
activities. The timing of G&A declines will vary and often lag the actual refranchising activities as the synergies are
typically dependent upon the size and geography of the respective deals. G&A expenses included in the tables below
reflect only direct G&A that we no longer incurred as a result of stores that were operated by us for all or some portion of
the respective previous year and were no longer operated by us as of the last day of the respective current year.
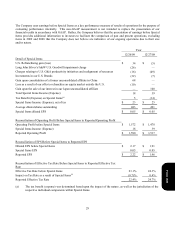
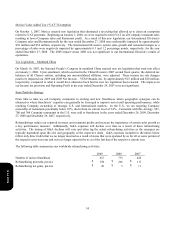
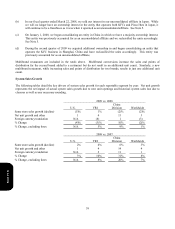
The following table summarizes our worldwide refranchising activities:
2009 2008 2007
N
umber of units refranchised 613 775 420
R
efranchising proceeds, pre-tax $ 194 $ 266 $ 117
R
efranchising net gains, pre-tax $ 26 $ 5 $ 11
Form 10-K