Pizza Hut 2009 Annual Report Download - page 65
Download and view the complete annual report
Please find page 65 of the 2009 Pizza Hut annual report below. You can navigate through the pages in the report by either clicking on the pages listed below, or by using the keyword search tool below to find specific information within the annual report.-
 1
1 -
2
-
3
-
4
-
5
-
6
-
7
-
8
-
9
-
10
-
11
-
12
-
13
-
14
-
15
-
16
-
17
-
18
-
19
-
20
-
21
-
22
-
23
-
24
-
25
-
26
-
27
-
28
-
29
-
30
-
31
-
32
-
33
-
34
-
35
-
36
-
37
-
38
-
39
-
40
-
41
-
42
-
43
-
44
-
45
-
46
-
47
-
48
-
49
-
50
-
51
-
52
-
53
-
54
-
 55
55 -
 56
56 -
 57
57 -
 58
58 -
 59
59 -
 60
60 -
 61
61 -
 62
62 -
 63
63 -
 64
64 -
 65
65 -
 66
66 -
 67
67 -
 68
68 -
 69
69 -
 70
70 -
 71
71 -
 72
72 -
 73
73 -
 74
74 -
 75
75 -
76
-
77
-
78
-
79
-
80
-
81
-
82
-
83
-
84
-
85
-
86
-
87
-
88
-
89
-
90
-
91
-
92
-
93
-
94
-
95
-
96
-
97
-
98
-
99
-
100
-
101
-
102
-
103
-
104
-
105
-
106
-
107
-
108
-
109
-
110
-
111
-
112
-
113
-
114
-
115
-
116
-
117
-
118
-
119
-
120
-
121
-
122
-
123
-
124
-
125
-
126
-
127
-
128
-
129
-
130
-
131
-
132
-
133
-
134
-
135
-
136
-
137
-
138
-
139
-
140
-
141
-
142
-
143
-
144
-
145
-
146
-
147
-
148
-
149
-
150
-
151
-
152
-
153
-
154
-
155
-
156
-
157
-
158
-
159
-
160
-
161
-
162
-
163
-
164
-
165
-
166
-
167
-
168
-
169
-
170
-
171
-
172
-
173
-
174
-
175
-
176
-
177
-
178
-
179
-
180
-
181
-
182
-
183
-
184
-
185
-
186
-
187
-
188
-
189
-
190
-
191
-
192
-
193
-
194
-
195
-
196
-
197
-
198
-
199
-
200
-
201
-
202
-
203
-
204
-
205
-
206
-
207
-
208
-
209
-
210
-
211
-
212
-
213
-
214
-
215
-
216
-
217
-
218
-
219
-
220
 |
 |

21MAR201012032309
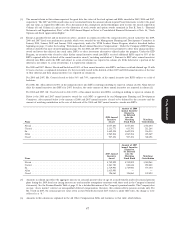
The following tables provide information on compensation and stock based awards paid, earned or
awarded for 2009, 2008 and 2007 by YUM to our Chief Executive Officer, Chief Financial Officer and our
three other most highly compensated executive officers for our 2009 fiscal year in accordance with the
rules of the SEC.
SUMMARY COMPENSATION TABLE
Change in
Pension
Value and
Non-Equity Nonqualified
Incentive Deferred
Stock Option/SAR Plan Compensation All Other
Name and Salary Awards Awards Compensation Earnings Compensation
Principal Position Year ($)(1) Bonus($) ($)(2) ($)(3) ($)(4) ($)(5) ($)(6) Total($)
(a) (b) (c) (d) (e) (f) (g) (h) (i)
David C. Novak 2009 1,400,000 739,989 4,192,111 2,993,760 3,565,977 239,455 13,131,292
Chairman, Chief 2008 1,393,846 — 8,342,345 4,711,780 4,057,200 5,255,931 239,709 24,000,811
Executive Officer 2007 1,312,308 — 1,580,964 4,335,422 4,742,892 1,647,578 203,939 13,823,103
and President
Richard T. Carucci 2009 711,923 224,994 1,479,567 907,818 1,083,683 50,713 4,458,698
Chief Financial 2008 669,231 — 845,057 2,650,380 497,980 1,131,924 36,963 5,831,535
Officer 2007 590,385 — 1,179,528 1,027,005 379,134 251,902 71,580 3,499,534
Jing-Shyh S. Su 2009 811,923 310,011 1,479,567 1,718,917 1,532,322 868,468 6,721,208
Vice Chairman, 2008 769,231 — 536,533 4,122,812 1,609,598 1,107,629 1,434,625 9,580,428
President, China 2007 686,539 — 573,300 1,173,732 1,719,900 1,486,408 1,408,513 7,048,392
Division
Graham D. Allan 2009 811,923 310,011 1,479,567 1,023,477 732,364 50,235 4,407,577
President, Yum! 2008 769,231 — 2,620,275 1,766,927 — 502,319 207,063 5,865,815
Restaurants 2007 688,462 — — 3,814,599 1,615,950 188,483 52,661 6,360,155
International
Greg Creed 2009 647,692 194,995 1,232,976 995,085 5,659 283,704 3,360,111
President and 2008 612,692 — 1,209,992 1,177,948 — 3,203 361,012 3,364,847
Chief Concept Officer, 2007 525,000 — 528,080 3,565,191 — — 267,824 4,886,095
Proxy Statement
Taco Bell U.S.
(1) Amounts shown are not reduced to reflect the NEOs’ elections, if any, to defer receipt of salary into the Executive Income Deferral
(‘‘EID’’) Program or into the Company’s 401(k) Plan.
(2) Amounts shown in this column represent the grant date fair values for performance share units (PSUs) granted in 2009 and restricted
stock units (RSUs) granted in 2008 and 2007. We recalculated the 2008 and 2007 awards from amounts shown in prior proxy statements
to reflect their grant date fair values, as required by SEC rules. Further information regarding the 2009 awards is included in the
‘‘Grants of Plan-Based Awards’’ and ‘‘Outstanding Equity Awards at Fiscal Year-End’ tables later in this Proxy Statement. The grant
date fair value of the PSUs reflected in this column is the target payout based on the probable outcome of the performance condition,
determined as of the grant date. The maximum potential values of the PSUs would be 200% of target. Mr. Novak’s PSU maximum value
at grant date fair value would be $1,479,979; Mr. Carucci’s PSU maximum value would be $449,988; Messrs. Su’s and Allan’s PSU
maximum value would be $620,021; and Mr. Creed’s PSU Award maximum value would be $389,989. The RSUs granted in 2008 and
2007 were granted pursuant to the EID Program with respect to annual incentives deferred into the EID and subject to a risk of
forfeiture at the time of deferral, rather than amounts paid or realized by each NEO. RSUs granted under the EID Program were
granted, as described in more detail beginning on page 58, when an executive elected to defer all or a portion of his/her annual incentive
award under the EID Program and invested that deferral in RSUs.
Under the terms of the EID Program for 2007 and 2008, an employee who is age 55 with 10 years of service is fully vested in the amount
of the deferral attributable to the actual incentive award. Upon attainment of this threshold, the matching contributions attributable to
the deferral is subject to forfeiture on a pro rata basis for the year following the deferral. Messrs. Novak and Su had attained this
threshold at the time of their 2007 and 2008 annual incentive awards and thus only the grant date fair value of the matching
contributions attributable to their 2007 and 2008 annual incentive awards are included in this column. The remainder of their deferrals
attributable to the 2007 and 2008 annual incentive awards (that is the amount not subject to forfeiture) are reported in column (f).
In Mr. Novak’s case, for 2008 this also represents the grant date fair value with respect to a RSU grant under our Long Term Incentive
Plan. The grant vests after four years and Mr. Novak may not sell the shares until 6 months following his retirement from the Company.
46