Pizza Hut 2009 Annual Report Download - page 198
Download and view the complete annual report
Please find page 198 of the 2009 Pizza Hut annual report below. You can navigate through the pages in the report by either clicking on the pages listed below, or by using the keyword search tool below to find specific information within the annual report.-
 1
1 -
2
-
3
-
4
-
5
-
6
-
7
-
8
-
9
-
10
-
11
-
12
-
13
-
14
-
15
-
16
-
17
-
18
-
19
-
20
-
21
-
22
-
23
-
24
-
25
-
26
-
27
-
28
-
29
-
30
-
31
-
32
-
33
-
34
-
35
-
36
-
37
-
38
-
39
-
40
-
41
-
42
-
43
-
44
-
45
-
46
-
47
-
48
-
49
-
50
-
51
-
52
-
53
-
54
-
55
-
56
-
57
-
58
-
59
-
60
-
61
-
62
-
63
-
64
-
65
-
66
-
67
-
68
-
69
-
70
-
71
-
72
-
73
-
74
-
75
-
76
-
77
-
78
-
79
-
80
-
81
-
82
-
83
-
84
-
85
-
86
-
87
-
88
-
89
-
90
-
91
-
92
-
93
-
94
-
95
-
96
-
97
-
98
-
99
-
100
-
101
-
102
-
103
-
104
-
105
-
106
-
107
-
108
-
109
-
110
-
111
-
112
-
113
-
114
-
115
-
116
-
117
-
118
-
119
-
120
-
121
-
122
-
123
-
124
-
125
-
126
-
127
-
128
-
129
-
130
-
131
-
132
-
133
-
134
-
135
-
136
-
137
-
138
-
139
-
140
-
141
-
142
-
143
-
144
-
145
-
146
-
147
-
148
-
149
-
150
-
151
-
152
-
153
-
154
-
155
-
156
-
157
-
158
-
159
-
160
-
161
-
162
-
163
-
164
-
165
-
166
-
167
-
168
-
169
-
170
-
171
-
172
-
173
-
174
-
175
-
176
-
177
-
178
-
179
-
180
-
181
-
182
-
183
-
184
-
185
-
186
-
187
-
 188
188 -
 189
189 -
 190
190 -
 191
191 -
 192
192 -
 193
193 -
 194
194 -
 195
195 -
 196
196 -
 197
197 -
 198
198 -
 199
199 -
 200
200 -
 201
201 -
 202
202 -
 203
203 -
 204
204 -
 205
205 -
 206
206 -
 207
207 -
 208
208 -
209
-
210
-
211
-
212
-
213
-
214
-
215
-
216
-
217
-
218
-
219
-
220
 |
 |

107
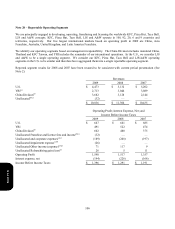
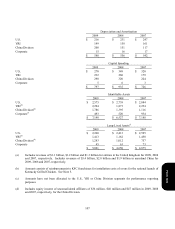
Depreciation and Amortization
2009 2008 2007
U.S. $ 216 $ 231 $ 247
YRI 149 158 161
China Division 200 151 117
Corporate 15 16 17
$ 580 $ 556 $ 542
Capital Spending
2009 2008 2007
U.S. $ 270 $ 349 $ 320
YRI 232 260 179
China Division 290 320 224
Corporate 5 6 3
$ 797 $ 935 $ 726
Identifiable Assets
2009 2008 2007
U.S. $ 2,575 $ 2,739 $ 2,884
YRI(h) 2,294 1,873 2,254
China Division(h) 1,786 1,395 1,116
Corporate(i) 493 520 934
$ 7,148 $ 6,527 $ 7,188
Lon
g
-Lived Assets(j)
2009 2008 2007
U.S. $ 2
,
260 $ 2
,
413 $ 2
,
595
YRI(k) 1,413 1,162 1,450
China Division(k) 1,283 1,012 757
Cor
p
orate 45 63 73
$ 5
,
001 $ 4
,
650 $ 4
,
875
(a)
I
ncludes revenues of $1.1 billion, $1.2 billion and $1.3 billion for entities in the United Kingdom for 2009, 2008
and 2007, respectively. Includes revenues of $3.4 billion, $2.8 billion and $1.9 billion in mainland China for
2
009, 2008 and 2007, respectively.
(b)
A
mount consists of reimbursements to KFC franchisees for installation costs of ovens for the national launch of
K
entucky Grilled Chicken. See Note 5.
(c)
A
mounts have not been allocated to the U.S., YRI or China Division segments for performance reporting
p
urposes.
(d)
I
ncludes equity income of unconsolidated affiliates of $36 million, $40 million and $47 million in 2009, 2008
and 2007, respectively, for the China Division.
Form 10-K