Pizza Hut 2009 Annual Report Download - page 54
Download and view the complete annual report
Please find page 54 of the 2009 Pizza Hut annual report below. You can navigate through the pages in the report by either clicking on the pages listed below, or by using the keyword search tool below to find specific information within the annual report.-
 1
1 -
2
-
3
-
4
-
5
-
6
-
7
-
8
-
9
-
10
-
11
-
12
-
13
-
14
-
15
-
16
-
17
-
18
-
19
-
20
-
21
-
22
-
23
-
24
-
25
-
26
-
27
-
28
-
29
-
30
-
31
-
32
-
33
-
34
-
35
-
36
-
37
-
38
-
39
-
40
-
41
-
42
-
43
-
 44
44 -
 45
45 -
 46
46 -
 47
47 -
 48
48 -
 49
49 -
 50
50 -
 51
51 -
 52
52 -
 53
53 -
 54
54 -
 55
55 -
 56
56 -
 57
57 -
 58
58 -
 59
59 -
 60
60 -
 61
61 -
 62
62 -
 63
63 -
 64
64 -
65
-
66
-
67
-
68
-
69
-
70
-
71
-
72
-
73
-
74
-
75
-
76
-
77
-
78
-
79
-
80
-
81
-
82
-
83
-
84
-
85
-
86
-
87
-
88
-
89
-
90
-
91
-
92
-
93
-
94
-
95
-
96
-
97
-
98
-
99
-
100
-
101
-
102
-
103
-
104
-
105
-
106
-
107
-
108
-
109
-
110
-
111
-
112
-
113
-
114
-
115
-
116
-
117
-
118
-
119
-
120
-
121
-
122
-
123
-
124
-
125
-
126
-
127
-
128
-
129
-
130
-
131
-
132
-
133
-
134
-
135
-
136
-
137
-
138
-
139
-
140
-
141
-
142
-
143
-
144
-
145
-
146
-
147
-
148
-
149
-
150
-
151
-
152
-
153
-
154
-
155
-
156
-
157
-
158
-
159
-
160
-
161
-
162
-
163
-
164
-
165
-
166
-
167
-
168
-
169
-
170
-
171
-
172
-
173
-
174
-
175
-
176
-
177
-
178
-
179
-
180
-
181
-
182
-
183
-
184
-
185
-
186
-
187
-
188
-
189
-
190
-
191
-
192
-
193
-
194
-
195
-
196
-
197
-
198
-
199
-
200
-
201
-
202
-
203
-
204
-
205
-
206
-
207
-
208
-
209
-
210
-
211
-
212
-
213
-
214
-
215
-
216
-
217
-
218
-
219
-
220
 |
 |

21MAR201012032
target will have on the calculation of annual incentive compensation. This leverage increases the financial
incentive for employees to exceed their targets and reduces payouts when the Team Performance Measure
is not reached.
During 2008, the Committee undertook an in-depth review of the process for setting the targets and
leverage formula for each specific Team Performance Measure. As a result of this review, the Committee
determined that the process for setting targets and the leverage formula was rigorous and consistent with
the Company’s process for building projections of anticipated results and, therefore, did not require
modification. The Committee and the Company did, however, adjust for 2009 the leverage formula for
below target performance requiring a higher level of performance relative to target to achieve a minimum
payment. This change reinforces our pay for performance philosophy and provides an appropriate level of
downside risk.
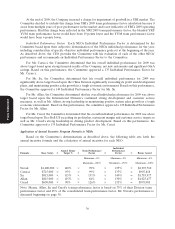
The team performance targets, actual team performance, team performance weights and team
performance factor for each measure are set forth below for the NEOs.
2009 Annual Incentive Compensation Team Performance (TP) Factor Calculation
TP Factor
TP based After
on leverage Applying
NEO TP Measures TP Target TP Actual formula TP Weight Weights\
Novak and Carucci Operating Profit Growth (Before Tax) 110 50% 55
Weighted Average of Divisions Performance
System Sales Growth 5.1% 0.9% 0 20% 0
System Net Builds 150 20% 30
Weighted Average of China and YRI
System Customer Satisfaction 143 10% 14
Weighted Average of Divisions Performance
Total Weighted TP Factor—Yum 99
Su Operating Profit Growth (Before Tax) 16% 23.6% 171 50% 86
System Sales Growth 16.0% 8.7% 0 20% 0
System Gross New Builds 500 567 200 20% 40
Proxy Statement
System Customer Satisfaction 72.4% 74.4% 167 10% 17
Total Weighted TP Factor—China Division 142
75% Division/25% Yum TP Factor 131
Allan Operating Profit Growth (Before Tax) 10% 7.5% 50 50% 25
System Sales Growth 6.0% 5.3% 72 20% 14
System Net Builds 450 449 99 20% 20
System Customer Satisfaction 45.0% 52.9% 200 10% 20
Total Weighted TP Factor—YRI Division 79
75% Division/25% Yum TP Factor 84
Creed Operating Profit Growth (Before Tax) 5% 11.3% 197 40% 79
System Same Store Sales Growth 2.0% (1.3%) 0 30% 0
Restaurant Margin 17.0% 18.4% 200 20% 40
System Customer Satisfaction 84.5% 86.2% 157 10% 16
Total Weighted TP Factor—Taco Bell U.S. 135
75% Division/25% Yum TP Factor 126
Division operating profit growth is based on actual year over year growth and is adjusted to exclude
the impact of any foreign currency translation. In the case of system sales growth, we include the results of
all restaurants, including Company-owned, franchised and licensed restaurants and it is based on year over
year growth and adjusted to exclude the impact of any foreign currency translation.
35