Pizza Hut 2009 Annual Report Download - page 195
Download and view the complete annual report
Please find page 195 of the 2009 Pizza Hut annual report below. You can navigate through the pages in the report by either clicking on the pages listed below, or by using the keyword search tool below to find specific information within the annual report.-
 1
1 -
2
-
3
-
4
-
5
-
6
-
7
-
8
-
9
-
10
-
11
-
12
-
13
-
14
-
15
-
16
-
17
-
18
-
19
-
20
-
21
-
22
-
23
-
24
-
25
-
26
-
27
-
28
-
29
-
30
-
31
-
32
-
33
-
34
-
35
-
36
-
37
-
38
-
39
-
40
-
41
-
42
-
43
-
44
-
45
-
46
-
47
-
48
-
49
-
50
-
51
-
52
-
53
-
54
-
55
-
56
-
57
-
58
-
59
-
60
-
61
-
62
-
63
-
64
-
65
-
66
-
67
-
68
-
69
-
70
-
71
-
72
-
73
-
74
-
75
-
76
-
77
-
78
-
79
-
80
-
81
-
82
-
83
-
84
-
85
-
86
-
87
-
88
-
89
-
90
-
91
-
92
-
93
-
94
-
95
-
96
-
97
-
98
-
99
-
100
-
101
-
102
-
103
-
104
-
105
-
106
-
107
-
108
-
109
-
110
-
111
-
112
-
113
-
114
-
115
-
116
-
117
-
118
-
119
-
120
-
121
-
122
-
123
-
124
-
125
-
126
-
127
-
128
-
129
-
130
-
131
-
132
-
133
-
134
-
135
-
136
-
137
-
138
-
139
-
140
-
141
-
142
-
143
-
144
-
145
-
146
-
147
-
148
-
149
-
150
-
151
-
152
-
153
-
154
-
155
-
156
-
157
-
158
-
159
-
160
-
161
-
162
-
163
-
164
-
165
-
166
-
167
-
168
-
169
-
170
-
171
-
172
-
173
-
174
-
175
-
176
-
177
-
178
-
179
-
180
-
181
-
182
-
183
-
184
-
 185
185 -
 186
186 -
 187
187 -
 188
188 -
 189
189 -
 190
190 -
 191
191 -
 192
192 -
 193
193 -
 194
194 -
 195
195 -
 196
196 -
 197
197 -
 198
198 -
 199
199 -
 200
200 -
 201
201 -
 202
202 -
 203
203 -
 204
204 -
 205
205 -
206
-
207
-
208
-
209
-
210
-
211
-
212
-
213
-
214
-
215
-
216
-
217
-
218
-
219
-
220
 |
 |

104
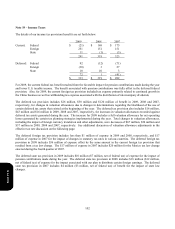
Our 2007 effective income tax rate was positively impacted by valuation allowance reversals. In December 2007, the
Company finalized various tax planning strategies based on completing a review of our international operations,
distributed a $275 million intercompany dividend and sold our interest in our Japan unconsolidated affiliate. As a result,
in the fourth quarter of 2007, we reversed approximately $82 million of valuation allowances associated with foreign tax
credit carryovers that are more likely than not to be claimed on future tax returns. In 2007, benefits associated with our
foreign and U.S. tax effects attributable to foreign operations were negatively impacted by $36 million of expense
associated with the $275 million intercompany dividend and approximately $20 million of expense for adjustments to our
deferred tax balances as a result of the Mexico tax law change enacted during the fourth quarter of 2007.
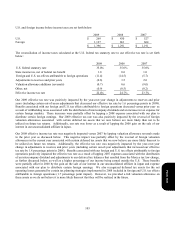
Adjustments to reserves and prior years include the effects of the reconciliation of income tax amounts recorded in our
Consolidated Statements of Income to amounts reflected on our tax returns, including any adjustments to the Consolidated
Balance Sheets. Adjustments to reserves and prior years also includes changes in tax reserves, including interest thereon,
established for potential exposure we may incur if a taxing authority takes a position on a matter contrary to our position.
We evaluate these reserves on a quarterly basis to ensure that they have been appropriately adjusted for events, including
audit settlements that we believe may impact our exposure.
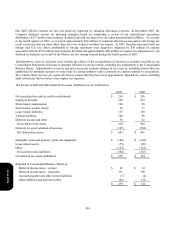
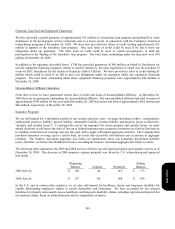
The details of 2009 and 2008 deferred tax assets (liabilities) are set forth below:
2009 2008
N
et operating loss and tax credit carryforwards
$
230 $ 256
Employee benefits 148 233
Share-based compensation 106 96
Self-insured casualty claims 59 71
Lease related liabilities 157 150
Various liabilities 100 98
Deferred income and other 30 41
Gross deferred tax assets 830 945
Deferred tax asset valuation allowances (187
)
(254)
Net deferred tax assets
$
643 $ 691
Intangible assets and property, plant and equipment
$
(184
)
$ (164)
Lease related assets (75
)
(69)
Other (125
)
(134)
Gross deferred tax liabilities (384
)
(367)
N
et deferred tax assets (liabilities)
$
259 $ 324
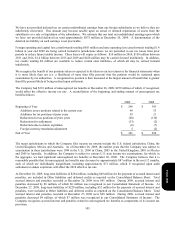
Reported in Consolidated Balance Sheets as:
Deferred income taxes – current
$
81 $ 81
Deferred income taxes – long-term 251 300
Accounts payable and other current liabilities (7 ) (4
)
Other liabilities and deferred credits (66
)
(53 )
$
259 $ 324
Form 10-K