Pizza Hut 2009 Annual Report Download - page 184
Download and view the complete annual report
Please find page 184 of the 2009 Pizza Hut annual report below. You can navigate through the pages in the report by either clicking on the pages listed below, or by using the keyword search tool below to find specific information within the annual report.-
 1
1 -
2
-
3
-
4
-
5
-
6
-
7
-
8
-
9
-
10
-
11
-
12
-
13
-
14
-
15
-
16
-
17
-
18
-
19
-
20
-
21
-
22
-
23
-
24
-
25
-
26
-
27
-
28
-
29
-
30
-
31
-
32
-
33
-
34
-
35
-
36
-
37
-
38
-
39
-
40
-
41
-
42
-
43
-
44
-
45
-
46
-
47
-
48
-
49
-
50
-
51
-
52
-
53
-
54
-
55
-
56
-
57
-
58
-
59
-
60
-
61
-
62
-
63
-
64
-
65
-
66
-
67
-
68
-
69
-
70
-
71
-
72
-
73
-
74
-
75
-
76
-
77
-
78
-
79
-
80
-
81
-
82
-
83
-
84
-
85
-
86
-
87
-
88
-
89
-
90
-
91
-
92
-
93
-
94
-
95
-
96
-
97
-
98
-
99
-
100
-
101
-
102
-
103
-
104
-
105
-
106
-
107
-
108
-
109
-
110
-
111
-
112
-
113
-
114
-
115
-
116
-
117
-
118
-
119
-
120
-
121
-
122
-
123
-
124
-
125
-
126
-
127
-
128
-
129
-
130
-
131
-
132
-
133
-
134
-
135
-
136
-
137
-
138
-
139
-
140
-
141
-
142
-
143
-
144
-
145
-
146
-
147
-
148
-
149
-
150
-
151
-
152
-
153
-
154
-
155
-
156
-
157
-
158
-
159
-
160
-
161
-
162
-
163
-
164
-
165
-
166
-
167
-
168
-
169
-
170
-
171
-
172
-
173
-
 174
174 -
 175
175 -
 176
176 -
 177
177 -
 178
178 -
 179
179 -
 180
180 -
 181
181 -
 182
182 -
 183
183 -
 184
184 -
 185
185 -
 186
186 -
 187
187 -
 188
188 -
 189
189 -
 190
190 -
 191
191 -
 192
192 -
 193
193 -
 194
194 -
195
-
196
-
197
-
198
-
199
-
200
-
201
-
202
-
203
-
204
-
205
-
206
-
207
-
208
-
209
-
210
-
211
-
212
-
213
-
214
-
215
-
216
-
217
-
218
-
219
-
220
 |
 |

93
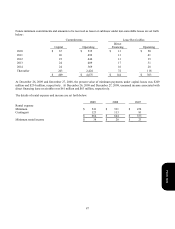
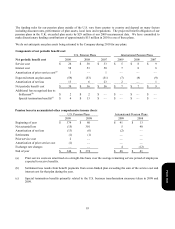
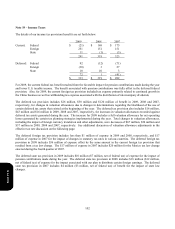
The funding rules for our pension plans outside of the U.S. vary from country to country and depend on many factors
including discount rates, performance of plan assets, local laws and regulations. The projected benefit obligation of our
pension plans in the U.K. exceeded plan assets by $29 million at our 2009 measurement date. We have committed to
make discretionary funding contributions of approximately $15 million in 2010 to one of these plans.
We do not anticipate any plan assets being returned to the Company during 2010 for any plans.
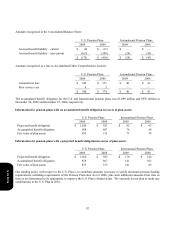
Components of net periodic benefit cost:
U.S. Pension Plans International Pension Plans
Net periodic benefit cost 2009 2008 2007 2009 2008 2007
Service cost $ 26 $ 30 $ 33 $ 5 $ 8 $ 9
Interest cost 58 53 50 7 8 8
Amortization of prior service cost(a) 1 — 1 — — —
Expected return on plan assets (59
)
(53 ) (51 ) (7
)
(9
)
(9
)
Amortization of net loss 13 6 23 2
—
1
Net periodic benefit cost $ 39 $ 36 $ 56 $ 7 $ 7 $ 9
Additional loss recognized due to:
Settlement(b) $ 2 $ 2 $
—
$
—
$
—
$
—
Special termination benefits(c) $ 4 $ 13 $
—
$
—
$
—
$
—
P
ension losses in accumulated other comprehensive income (loss):
U.S. Pension Plans International Pension Plans
2009 2008 2009
2008
Beginning of year $ 374 $ 80 $ 41
$ 13
N
et actuarial loss (15
)
301 5
40
Amortization of net loss (13
)
(6
)
(2
)
—
Settlements (1
)
(1
)
—
—
Prior service cost 2 — —
—
Amortization of prior service cost (1
)
— —
—
Exchange rate changes —
—
4
(12
)
End of year $ 346 $ 374 $ 48
$ 41
(a)
P
rior service costs are amortized on a straight-line basis over the average remaining service period of employees
e
xpected to receive benefits.
(b) Settlement loss results from benefit payments from a non-funded plan exceeding the sum of the service cost and
i
nterest cost for that plan during the year.
(c) Special termination benefits primarily related to the U.S. business transformation measures taken in 2008 and
2
009.
Form 10-K