Pizza Hut 2009 Annual Report Download - page 199
Download and view the complete annual report
Please find page 199 of the 2009 Pizza Hut annual report below. You can navigate through the pages in the report by either clicking on the pages listed below, or by using the keyword search tool below to find specific information within the annual report.-
 1
1 -
2
-
3
-
4
-
5
-
6
-
7
-
8
-
9
-
10
-
11
-
12
-
13
-
14
-
15
-
16
-
17
-
18
-
19
-
20
-
21
-
22
-
23
-
24
-
25
-
26
-
27
-
28
-
29
-
30
-
31
-
32
-
33
-
34
-
35
-
36
-
37
-
38
-
39
-
40
-
41
-
42
-
43
-
44
-
45
-
46
-
47
-
48
-
49
-
50
-
51
-
52
-
53
-
54
-
55
-
56
-
57
-
58
-
59
-
60
-
61
-
62
-
63
-
64
-
65
-
66
-
67
-
68
-
69
-
70
-
71
-
72
-
73
-
74
-
75
-
76
-
77
-
78
-
79
-
80
-
81
-
82
-
83
-
84
-
85
-
86
-
87
-
88
-
89
-
90
-
91
-
92
-
93
-
94
-
95
-
96
-
97
-
98
-
99
-
100
-
101
-
102
-
103
-
104
-
105
-
106
-
107
-
108
-
109
-
110
-
111
-
112
-
113
-
114
-
115
-
116
-
117
-
118
-
119
-
120
-
121
-
122
-
123
-
124
-
125
-
126
-
127
-
128
-
129
-
130
-
131
-
132
-
133
-
134
-
135
-
136
-
137
-
138
-
139
-
140
-
141
-
142
-
143
-
144
-
145
-
146
-
147
-
148
-
149
-
150
-
151
-
152
-
153
-
154
-
155
-
156
-
157
-
158
-
159
-
160
-
161
-
162
-
163
-
164
-
165
-
166
-
167
-
168
-
169
-
170
-
171
-
172
-
173
-
174
-
175
-
176
-
177
-
178
-
179
-
180
-
181
-
182
-
183
-
184
-
185
-
186
-
187
-
188
-
 189
189 -
 190
190 -
 191
191 -
 192
192 -
 193
193 -
 194
194 -
 195
195 -
 196
196 -
 197
197 -
 198
198 -
 199
199 -
 200
200 -
 201
201 -
 202
202 -
 203
203 -
 204
204 -
 205
205 -
 206
206 -
 207
207 -
 208
208 -
 209
209 -
210
-
211
-
212
-
213
-
214
-
215
-
216
-
217
-
218
-
219
-
220
 |
 |

108
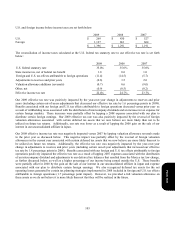
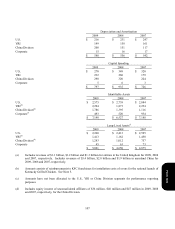
(e)
2
009 and 2008 includes approximately $16 million and $49 million, respectively, of charges relating to U.S.
general and administrative productivity initiatives and realignment of resources. Additionally, 2008 includes $7
m
illion of charges relating to investments in our U.S. Brands. See Note 5.
(f)
2
009 includes a $26 million charge to write-off goodwill associated with our LJS and A&W businesses in the
U
.S. See Note 10.
(g)
2
009 includes a $68 million gain related to the acquisition of additional interest in and consolidation of a former
unconsolidated affiliate and 2008 includes a $100 million gain recognized on the sale of our interest in our
u
nconsolidated affiliate in Japan. See Note 5.
(h)
T
here was no investment in unconsolidated affiliates for YRI in 2009 or 2008, as we sold our interest in our
unconsolidated affiliate in Japan during 2008. See Note 5. YRI had an investment in our Japan unconsolidated
affiliate of $63 million for 2007. China Division includes investment in 4 unconsolidated affiliates totaling $144
million for 2009. 2008 and 2007 includes investments in unconsolidated affiliates of $65 million and $90
million, respectively, for the China Division. The 2009 increase was driven by our acquisition of interest in
Little Sheep, net of our acquisition of additional interest in and consolidation of our unconsolidated affiliate in
Shanghai, China. See Note 5.
(i)
P
rimarily includes deferred tax assets, property, plant and equipment, net, related to our office facilities and cash.
(j)
I
ncludes property, plant and equipment, net, goodwill, and intangible assets, net.
(k)
I
ncludes long-lived assets of $660 million, $602 million and $843 million for entities in the United Kingdom for
2009, 2008 and 2007, respectively. The yearly fluctuations in long-lived assets were primarily driven by the
impact of foreign currency. Includes long-lived assets of $1.2 billion, $905 million and $651 million in
m
ainland China for 2009, 2008 and 2007, respectively.
See Note 5 for additional operating segment disclosures related to impairment, store closure (income) costs and the
carrying amount of assets held for sale.
Note 21 – Contingencies
Lease Guarantees
As a result of (a) assigning our interest in obligations under real estate leases as a condition to the refranchising of certain
Company restaurants; (b) contributing certain Company restaurants to unconsolidated affiliates; and (c) guaranteeing
certain other leases, we are frequently contingently liable on lease agreements. These leases have varying terms, the latest
of which expires in 2026. As of December 26, 2009, the potential amount of undiscounted payments we could be
required to make in the event of non-payment by the primary lessee was approximately $500 million. The present value
of these potential payments discounted at our pre-tax cost of debt at December 26, 2009 was approximately $425 million.
Our franchisees are the primary lessees under the vast majority of these leases. We generally have cross-default
provisions with these franchisees that would put them in default of their franchise agreement in the event of non-payment
under the lease. We believe these cross-default provisions significantly reduce the risk that we will be required to make
payments under these leases. Accordingly, the liability recorded for our probable exposure under such leases at December
26, 2009 and December 27, 2008 was not material.
Form 10-K