Pizza Hut 2009 Annual Report Download - page 131
Download and view the complete annual report
Please find page 131 of the 2009 Pizza Hut annual report below. You can navigate through the pages in the report by either clicking on the pages listed below, or by using the keyword search tool below to find specific information within the annual report.-
 1
1 -
2
-
3
-
4
-
5
-
6
-
7
-
8
-
9
-
10
-
11
-
12
-
13
-
14
-
15
-
16
-
17
-
18
-
19
-
20
-
21
-
22
-
23
-
24
-
25
-
26
-
27
-
28
-
29
-
30
-
31
-
32
-
33
-
34
-
35
-
36
-
37
-
38
-
39
-
40
-
41
-
42
-
43
-
44
-
45
-
46
-
47
-
48
-
49
-
50
-
51
-
52
-
53
-
54
-
55
-
56
-
57
-
58
-
59
-
60
-
61
-
62
-
63
-
64
-
65
-
66
-
67
-
68
-
69
-
70
-
71
-
72
-
73
-
74
-
75
-
76
-
77
-
78
-
79
-
80
-
81
-
82
-
83
-
84
-
85
-
86
-
87
-
88
-
89
-
90
-
91
-
92
-
93
-
94
-
95
-
96
-
97
-
98
-
99
-
100
-
101
-
102
-
103
-
104
-
105
-
106
-
107
-
108
-
109
-
110
-
111
-
112
-
113
-
114
-
115
-
116
-
117
-
118
-
119
-
120
-
 121
121 -
 122
122 -
 123
123 -
 124
124 -
 125
125 -
 126
126 -
 127
127 -
 128
128 -
 129
129 -
 130
130 -
 131
131 -
 132
132 -
 133
133 -
 134
134 -
 135
135 -
 136
136 -
 137
137 -
 138
138 -
 139
139 -
 140
140 -
 141
141 -
142
-
143
-
144
-
145
-
146
-
147
-
148
-
149
-
150
-
151
-
152
-
153
-
154
-
155
-
156
-
157
-
158
-
159
-
160
-
161
-
162
-
163
-
164
-
165
-
166
-
167
-
168
-
169
-
170
-
171
-
172
-
173
-
174
-
175
-
176
-
177
-
178
-
179
-
180
-
181
-
182
-
183
-
184
-
185
-
186
-
187
-
188
-
189
-
190
-
191
-
192
-
193
-
194
-
195
-
196
-
197
-
198
-
199
-
200
-
201
-
202
-
203
-
204
-
205
-
206
-
207
-
208
-
209
-
210
-
211
-
212
-
213
-
214
-
215
-
216
-
217
-
218
-
219
-
220
 |
 |

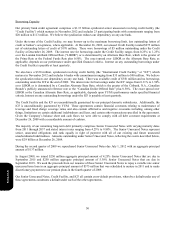
40
YRI
2009 vs. 2008
Income / (Expense)
2008
Store
Portfolio
Actions Other FX 2009
Company Sales $ 2,375 $ 26 $ 34 $ (382 ) $ 2,053
Cost of Sales
(
752
)
(
11
)
(
16
)
123
(
656
)
Cost of Labor (618 ) (6 ) (6 ) 97 (533)
Occupancy and Other
(
742
)
(
6
)
(
9
)
122
(
635
)
Restaurant Profit
$
263
$
3
$
3
$
(
40
)
$
229
Restaurant Margin 11.1 % 11.1
%
2008 vs. 2007
Income / (Expense)
2007
Store
Portfolio
Actions Other FX 2008
Company Sales $ 2,507 $ (75 ) $ (10 ) $ (47 ) $ 2,375
Cost of Sales
(
751
)
17
(
29
)
11
(
752
)
Cost of Labor (655 ) 25 (1 ) 13 (618)
Occupancy and Other
(
794
)
27 3 22
(
742
)
Restaurant Profit
$
307
$
(
6
)
$
(
37
)
$
(
1
)
$
263
Restaurant Margin 12.3 % 11.1
%
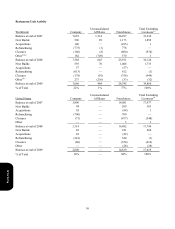
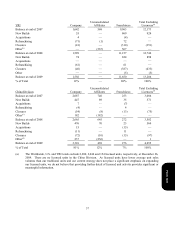
In 2009, the increase in YRI Company Sales and Restaurant Profit associated with store portfolio actions was driven by
new unit development partially offset by refranchising and closures. Significant other factors impacting Company Sales
and/or Restaurant Profit were Company same store sales growth of 1% due to higher average guest check, commodity
inflation, higher labor costs (primarily wage rate and salary increases) and higher occupancy costs.
In 2008, the decrease in YRI Company Sales and Restaurant Profit associated with store portfolio actions was driven by
refranchising and closures, partially offset by new unit development. Significant other factors impacting Company Sales
and/or Restaurant Profit were the elimination of a VAT exemption in Mexico with an estimated negative impact of $38
million and $34 million, respectively. An increase in commodity costs was partially offset by higher average guest check.
China Division
2009 vs. 2008
Income / (Expense)
2008
Store
Portfolio
Actions Other FX 2009
Company Sales $ 3,058 $ 548 $ (22) $ 38 $ 3,622
Cost of Sales (1,152
) (199) 87 (13 ) (1,277 )
Cost of Labor (423 ) (81) 8 (4 ) (500 )
Occupancy and Other
(
919
)
(
196
)
12
(
11
)
(
1
,
114
)
Restaurant Profit
$
564
$
72
$
85
$
10
$
731
Restaurant Margin 18.4 % 20.2
%
Form 10-K