Pizza Hut 2009 Annual Report Download - page 57
Download and view the complete annual report
Please find page 57 of the 2009 Pizza Hut annual report below. You can navigate through the pages in the report by either clicking on the pages listed below, or by using the keyword search tool below to find specific information within the annual report.-
 1
1 -
2
-
3
-
4
-
5
-
6
-
7
-
8
-
9
-
10
-
11
-
12
-
13
-
14
-
15
-
16
-
17
-
18
-
19
-
20
-
21
-
22
-
23
-
24
-
25
-
26
-
27
-
28
-
29
-
30
-
31
-
32
-
33
-
34
-
35
-
36
-
37
-
38
-
39
-
40
-
41
-
42
-
43
-
44
-
45
-
46
-
 47
47 -
 48
48 -
 49
49 -
 50
50 -
 51
51 -
 52
52 -
 53
53 -
 54
54 -
 55
55 -
 56
56 -
 57
57 -
 58
58 -
 59
59 -
 60
60 -
 61
61 -
 62
62 -
 63
63 -
 64
64 -
 65
65 -
 66
66 -
 67
67 -
68
-
69
-
70
-
71
-
72
-
73
-
74
-
75
-
76
-
77
-
78
-
79
-
80
-
81
-
82
-
83
-
84
-
85
-
86
-
87
-
88
-
89
-
90
-
91
-
92
-
93
-
94
-
95
-
96
-
97
-
98
-
99
-
100
-
101
-
102
-
103
-
104
-
105
-
106
-
107
-
108
-
109
-
110
-
111
-
112
-
113
-
114
-
115
-
116
-
117
-
118
-
119
-
120
-
121
-
122
-
123
-
124
-
125
-
126
-
127
-
128
-
129
-
130
-
131
-
132
-
133
-
134
-
135
-
136
-
137
-
138
-
139
-
140
-
141
-
142
-
143
-
144
-
145
-
146
-
147
-
148
-
149
-
150
-
151
-
152
-
153
-
154
-
155
-
156
-
157
-
158
-
159
-
160
-
161
-
162
-
163
-
164
-
165
-
166
-
167
-
168
-
169
-
170
-
171
-
172
-
173
-
174
-
175
-
176
-
177
-
178
-
179
-
180
-
181
-
182
-
183
-
184
-
185
-
186
-
187
-
188
-
189
-
190
-
191
-
192
-
193
-
194
-
195
-
196
-
197
-
198
-
199
-
200
-
201
-
202
-
203
-
204
-
205
-
206
-
207
-
208
-
209
-
210
-
211
-
212
-
213
-
214
-
215
-
216
-
217
-
218
-
219
-
220
 |
 |

21MAR201012032309
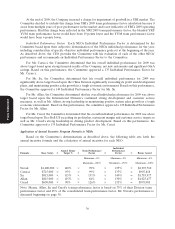
How we Compensate our Chief Executive Officer
Comparative Compensation Data for Mr. Novak
The discussion of the comparative compensation data and peer group used by the Committee for
Mr. Novak begins at page 31. Hewitt provided a comprehensive review for the Committee using data from
the peer group.
Mr. Novak’s Compensation
Each year, our Board, under the leadership of the Committee Chairperson, conducts an evaluation of
the performance of our CEO, David Novak. This evaluation includes a review of his:
• leadership pertaining to business execution and the achievement of business results
• leadership in the development and implementation of Company strategies
• development of culture, diversity and talent management
In setting compensation opportunities for 2009, the Committee considered the historical performance
of the Company since its inception, noting that Mr. Novak had been President for each of those years,
CEO since 2000 and Chairman since 2001. The Committee noted that for the prior ten, five and one year
periods, the Company had on average performed very strongly compared to the nondurable consumer
products peer group in terms of total shareholder return (top quartile), return on net assets (top quartile),
EPS growth (top 50%) and operating income growth (top 50%). Based on this sustained strong
performance, the Committee determined that Mr. Novak’s target total compensation for 2009 should be
set near or at the 75th percentile as compared to the compensation of chief executives in the peer group.
Based on this analysis, the Committee approved the following compensation for 2009:
Salary $1,400,000
Target Bonus Percentage 160%
Grant Date Estimated Fair Value of 2009 LTI Award: $7,040,000
Proxy Statement
Stock Appreciation Rights $4,947,600
RSUs—Deferral of 2008 Annual Incentive $1,352,400
PSUs $740,000
After the adjustments described below, the Committee noted that the total target compensation for
Mr. Novak was at the 75th percentile of the CEO peer group.
The Committee chose to keep Mr. Novak’s base salary at $1,400,000 and approved a target bonus
percentage increase of ten percentage points based on its desire to compensate Mr. Novak at the
75th percentile for target total cash and target total compensation and their subjective assessment of
Mr. Novak’s demonstrated strong and effective performance. The Committee structured this
compensation in line with YUM’s pay for performance philosophy of rewarding performance by increasing
his target bonus percentage and making more of the additional compensation at risk.
In January 2009, the Committee approved the grant date value of the long-term incentive award
having a value of $6.3 million. This award was comprised of SARs with an estimated fair value of
$4.95 million, and matching restricted stock units (‘‘RSUs’’) under the deferral plan with a value of
$1.35 million (discussed further below). This award reflected the Committee’s subjective determination
that, based on his strong performance in 2008 and the sustained performance of the Company (without
assigning any weight to any particular item), he should receive a long-term incentive award consistent with
their desire to compensate Mr. Novak near or at the 75th percentile for total compensation. In making this
38