Pizza Hut 2008 Annual Report Download - page 83
Download and view the complete annual report
Please find page 83 of the 2008 Pizza Hut annual report below. You can navigate through the pages in the report by either clicking on the pages listed below, or by using the keyword search tool below to find specific information within the annual report.-
 1
1 -
2
-
3
-
4
-
5
-
6
-
7
-
8
-
9
-
10
-
11
-
12
-
13
-
14
-
15
-
16
-
17
-
18
-
19
-
20
-
21
-
22
-
23
-
24
-
25
-
26
-
27
-
28
-
29
-
30
-
31
-
32
-
33
-
34
-
35
-
36
-
37
-
38
-
39
-
40
-
41
-
42
-
43
-
44
-
45
-
46
-
47
-
48
-
49
-
50
-
51
-
52
-
53
-
54
-
55
-
56
-
57
-
58
-
59
-
60
-
61
-
62
-
63
-
64
-
65
-
66
-
67
-
68
-
69
-
70
-
71
-
72
-
 73
73 -
 74
74 -
 75
75 -
 76
76 -
 77
77 -
 78
78 -
 79
79 -
 80
80 -
 81
81 -
 82
82 -
 83
83 -
 84
84 -
 85
85 -
 86
86 -
 87
87 -
 88
88 -
 89
89 -
 90
90 -
 91
91 -
 92
92 -
 93
93 -
94
-
95
-
96
-
97
-
98
-
99
-
100
-
101
-
102
-
103
-
104
-
105
-
106
-
107
-
108
-
109
-
110
-
111
-
112
-
113
-
114
-
115
-
116
-
117
-
118
-
119
-
120
-
121
-
122
-
123
-
124
-
125
-
126
-
127
-
128
-
129
-
130
-
131
-
132
-
133
-
134
-
135
-
136
-
137
-
138
-
139
-
140
-
141
-
142
-
143
-
144
-
145
-
146
-
147
-
148
-
149
-
150
-
151
-
152
-
153
-
154
-
155
-
156
-
157
-
158
-
159
-
160
-
161
-
162
-
163
-
164
-
165
-
166
-
167
-
168
-
169
-
170
-
171
-
172
-
173
-
174
-
175
-
176
-
177
-
178
-
179
-
180
-
181
-
182
-
183
-
184
-
185
-
186
-
187
-
188
-
189
-
190
-
191
-
192
-
193
-
194
-
195
-
196
-
197
-
198
-
199
-
200
-
201
-
202
-
203
-
204
-
205
-
206
-
207
-
208
-
209
-
210
-
211
-
212
-
213
-
214
-
215
-
216
-
217
-
218
-
219
-
220
-
221
-
222
-
223
-
224
-
225
-
226
-
227
-
228
-
229
-
230
-
231
-
232
-
233
-
234
-
235
-
236
-
237
-
238
-
239
-
240
 |
 |

23MAR200920295069
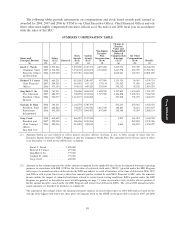
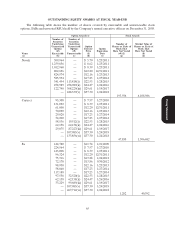
OUTSTANDING EQUITY AWARDS AT FISCAL YEAR-END
The following table shows the number of shares covered by exercisable and unexercisable stock
options, SARs and unvested RSUs held by the Company’s named executive officers on December 31, 2008.
Option Awards(1) Stock Awards
Number of Number of
Securities Securities
Underlying Underlying Number of Market Value of
Unexercised Unexercised Option Shares or Units of Shares or Units of
Options Options Exercise Option Stock That Stock That
(#) (#) Price Expiration Have Not Vested Have Not Vested
Name Exercisable Unexercisable ($) Date (#)(2) ($)
(a) (b) (c) (d) (e) (g) (h)
Novak 309,964 — $ 5.70 1/25/2011
1,239,856 — $ 8.62 1/25/2011
1,012,960 — $ 8.39 1/25/2011
802,696 — $12.20 12/31/2011
824,574 — $12.16 1/23/2013
585,934 — $17.23 1/27/2014
341,454 113,818(i) $22.53 1/28/2015
258,989 258,989(ii) $24.47 1/26/2016
122,740 368,220(iii) $29.61 1/19/2017
— 428,339(v) $37.30 1/24/2018
193,936 6,108,986
Carucci 95,308 — $ 7.57 1/27/2010
131,092 — $ 8.39 1/25/2011
61,808 — $12.20 12/31/2011
70,090 — $12.16 1/23/2013
29,020 — $17.23 1/27/2014
54,200 — $17.23 1/27/2014
58,536 19,512(i) $22.53 1/28/2015
Proxy Statement
62,158 62,158(ii) $24.47 1/26/2016
29,075 87,227(iii) $29.61 1/19/2017
— 107,085(v) $37.30 1/24/2018
— 133,856(vi) $37.30 1/24/2018
47,830 1,506,682
Su 144,780 — $11.74 1/21/2009
224,564 — $ 7.57 1/27/2010
143,008 — $ 8.39 1/25/2011
96,324 — $12.20 12/31/2011
75,316 — $13.28 1/24/2012
72,178 — $13.86 9/30/2012
98,950 — $12.16 1/23/2013
58,040 — $17.23 1/27/2014
117,188 — $17.23 1/27/2014
97,558 32,520(i) $22.53 1/28/2015
62,158 62,158(ii) $24.47 1/26/2016
33,229 99,689(iii) $29.61 1/19/2017
— 107,085(v) $37.30 1/24/2018
— 267,712(vi) $37.30 1/24/2018
1,282 40,392
65