Pizza Hut 2008 Annual Report Download - page 64
Download and view the complete annual report
Please find page 64 of the 2008 Pizza Hut annual report below. You can navigate through the pages in the report by either clicking on the pages listed below, or by using the keyword search tool below to find specific information within the annual report.-
 1
1 -
2
-
3
-
4
-
5
-
6
-
7
-
8
-
9
-
10
-
11
-
12
-
13
-
14
-
15
-
16
-
17
-
18
-
19
-
20
-
21
-
22
-
23
-
24
-
25
-
26
-
27
-
28
-
29
-
30
-
31
-
32
-
33
-
34
-
35
-
36
-
37
-
38
-
39
-
40
-
41
-
42
-
43
-
44
-
45
-
46
-
47
-
48
-
49
-
50
-
51
-
52
-
53
-
 54
54 -
 55
55 -
 56
56 -
 57
57 -
 58
58 -
 59
59 -
 60
60 -
 61
61 -
 62
62 -
 63
63 -
 64
64 -
 65
65 -
 66
66 -
 67
67 -
 68
68 -
 69
69 -
 70
70 -
 71
71 -
 72
72 -
 73
73 -
 74
74 -
75
-
76
-
77
-
78
-
79
-
80
-
81
-
82
-
83
-
84
-
85
-
86
-
87
-
88
-
89
-
90
-
91
-
92
-
93
-
94
-
95
-
96
-
97
-
98
-
99
-
100
-
101
-
102
-
103
-
104
-
105
-
106
-
107
-
108
-
109
-
110
-
111
-
112
-
113
-
114
-
115
-
116
-
117
-
118
-
119
-
120
-
121
-
122
-
123
-
124
-
125
-
126
-
127
-
128
-
129
-
130
-
131
-
132
-
133
-
134
-
135
-
136
-
137
-
138
-
139
-
140
-
141
-
142
-
143
-
144
-
145
-
146
-
147
-
148
-
149
-
150
-
151
-
152
-
153
-
154
-
155
-
156
-
157
-
158
-
159
-
160
-
161
-
162
-
163
-
164
-
165
-
166
-
167
-
168
-
169
-
170
-
171
-
172
-
173
-
174
-
175
-
176
-
177
-
178
-
179
-
180
-
181
-
182
-
183
-
184
-
185
-
186
-
187
-
188
-
189
-
190
-
191
-
192
-
193
-
194
-
195
-
196
-
197
-
198
-
199
-
200
-
201
-
202
-
203
-
204
-
205
-
206
-
207
-
208
-
209
-
210
-
211
-
212
-
213
-
214
-
215
-
216
-
217
-
218
-
219
-
220
-
221
-
222
-
223
-
224
-
225
-
226
-
227
-
228
-
229
-
230
-
231
-
232
-
233
-
234
-
235
-
236
-
237
-
238
-
239
-
240
 |
 |

23MAR200920294881
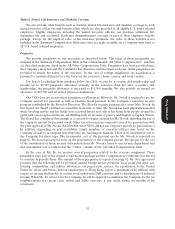
shareholder commitments such as earnings per share growth, ROIC and cash flow. The targets are the
same that we disclose from time to time to our investors and may be slightly above or below disclosed
guidance when determined by our Compensation Committee to be appropriate. A leverage formula for
each Team Performance Measure magnifies the potential impact that performance above or below the
target will have on the calculation of annual incentive compensation. This leverage increases the financial
incentive for employees to exceed their targets and reduces payouts when the Team Performance Measure
is not reached.
Division operating profit growth is based on actual year over year growth and is adjusted to exclude
the impact of any foreign currency translation. For Messrs. Novak and Carucci the operating profit growth
goal was the weighted average profit growth of our U.S. Brands, the China Division and the International
Division. (For 2008, the Committee, in Mr. Novak’s and Carucci’s case, began using weighted average of
operating profit Team Performance Measure in place of earnings per share because it provided a better
measure of executive performance in light of our strategy to refranchise restaurants.) In the case of system
sales growth, we include the results of all restaurants, including Company-owned, franchised and licensed
restaurants and it is based on year over year growth and adjusted to exclude the impact of any foreign
currency translation. Development is measured based on system net builds for Messrs. Novak and Carucci,
system gross new builds for the China Division, system net new builds for the International Division and
the impact of development on system sales for the Taco Bell U.S. brand. In the case of customer
satisfaction, the performance target represents the percentage of total system stores that must achieve a
100% customer satisfaction score. For Messrs. Novak and Carucci, the customer satisfaction goal was the
weighted average score of our U.S. Brands, the China Division and the International Division.
During 2008, the Committee undertook an in-depth review of the process for setting the targets and
leverage formula for each specific Team Performance Measure. As a result of this review, the Committee
determined that the process for setting targets and the leverage formula was rigorous and consistent with
the Company’s process for building projections of anticipated results and, therefore, did not require
modification. The Committee and the Company did adjust, for future years, the leverage formula for
below target performance resulting in higher threshold performance for profit, sales and development.
This change reinforces our pay for performance philosophy and provides an appropriate level of downside
risk.
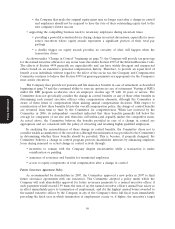
Proxy Statement
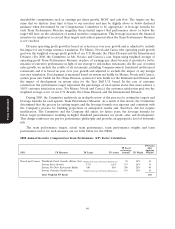
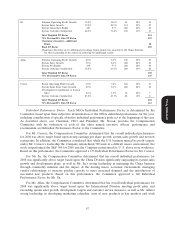
The team performance targets, actual team performance, team performance weights and team
performance factor for each measure are set forth below for the NEOs.
2008 Annual Incentive Compensation Team Performance (TP) Factor Calculation
TP Factor
TP based After
on leverage Applying
NEO TP Measures TP Target TP Actual formula TP Weight Weights
Novak and Carucci Worldwide Profit Growth (Before Tax) 90 50% 45
Weighted Average of Divisions Performance
System Sales Growth 5.2% 6.6% 197 20% 39
System Net New Restaurant Builds 680 884 200 20% 40
System Customer Satisfaction 139 10% 14
Weighted Average of Divisions Performance
Total Weighted TP Factor 138
46