Pizza Hut 2008 Annual Report Download - page 145
Download and view the complete annual report
Please find page 145 of the 2008 Pizza Hut annual report below. You can navigate through the pages in the report by either clicking on the pages listed below, or by using the keyword search tool below to find specific information within the annual report.-
 1
1 -
2
-
3
-
4
-
5
-
6
-
7
-
8
-
9
-
10
-
11
-
12
-
13
-
14
-
15
-
16
-
17
-
18
-
19
-
20
-
21
-
22
-
23
-
24
-
25
-
26
-
27
-
28
-
29
-
30
-
31
-
32
-
33
-
34
-
35
-
36
-
37
-
38
-
39
-
40
-
41
-
42
-
43
-
44
-
45
-
46
-
47
-
48
-
49
-
50
-
51
-
52
-
53
-
54
-
55
-
56
-
57
-
58
-
59
-
60
-
61
-
62
-
63
-
64
-
65
-
66
-
67
-
68
-
69
-
70
-
71
-
72
-
73
-
74
-
75
-
76
-
77
-
78
-
79
-
80
-
81
-
82
-
83
-
84
-
85
-
86
-
87
-
88
-
89
-
90
-
91
-
92
-
93
-
94
-
95
-
96
-
97
-
98
-
99
-
100
-
101
-
102
-
103
-
104
-
105
-
106
-
107
-
108
-
109
-
110
-
111
-
112
-
113
-
114
-
115
-
116
-
117
-
118
-
119
-
120
-
121
-
122
-
123
-
124
-
125
-
126
-
127
-
128
-
129
-
130
-
131
-
132
-
133
-
134
-
 135
135 -
 136
136 -
 137
137 -
 138
138 -
 139
139 -
 140
140 -
 141
141 -
 142
142 -
 143
143 -
 144
144 -
 145
145 -
 146
146 -
 147
147 -
 148
148 -
 149
149 -
 150
150 -
 151
151 -
 152
152 -
 153
153 -
 154
154 -
 155
155 -
156
-
157
-
158
-
159
-
160
-
161
-
162
-
163
-
164
-
165
-
166
-
167
-
168
-
169
-
170
-
171
-
172
-
173
-
174
-
175
-
176
-
177
-
178
-
179
-
180
-
181
-
182
-
183
-
184
-
185
-
186
-
187
-
188
-
189
-
190
-
191
-
192
-
193
-
194
-
195
-
196
-
197
-
198
-
199
-
200
-
201
-
202
-
203
-
204
-
205
-
206
-
207
-
208
-
209
-
210
-
211
-
212
-
213
-
214
-
215
-
216
-
217
-
218
-
219
-
220
-
221
-
222
-
223
-
224
-
225
-
226
-
227
-
228
-
229
-
230
-
231
-
232
-
233
-
234
-
235
-
236
-
237
-
238
-
239
-
240
 |
 |

23
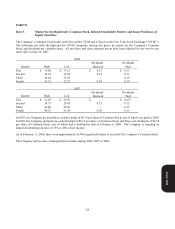
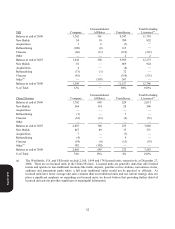
Fiscal years 2008, 2007, 2006 and 2004 include 52 weeks and fiscal year 2005 includes 53 weeks.
Fiscal years 2008, 2007, 2006 and 2005 include the impact of the adoption of Statement of Financial Accounting
Standards (“SFAS”) No. 123R (Revised 2004), “Share Based Payment,” (“SFAS 123R”). If SFAS 123R had been
effective for 2004 both reported basic and diluted earnings per share would have decreased $0.06 consistent with pro-
forma information that was disclosed previous to that date.
The selected financial data should be read in conjunction with the Consolidated Financial Statements and the Notes
thereto.
(a) See Note 5 to the Consolidated Financial Statements for a description of Closures and Impairment Expenses and
Refranchising Gain (Loss) in 2008, 2007 and 2006.
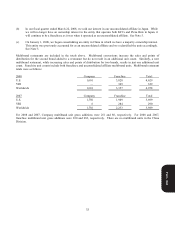
(b) Fiscal year 2008 included a gain of approximately $100 million related to the sale of our interest in our
unconsolidated affiliate in Japan and $61 million expense related to U.S. business transformation measures as
discussed in the Significant Gains and Charges section of the MD&A. Fiscal year 2004 included $30 million of
income related to Wrench litigation and AmeriServe. The Wrench litigation relates to a lawsuit against Taco
Bell Corporation, which was settled in 2004, and the income was a result of financial recoveries from
settlements with insurance carriers. Amounts related to AmeriServe are the result of cash recoveries related to
the AmeriServe bankruptcy reorganization process for which we incurred significant expense in years prior to
those presented here (primarily 2000). AmeriServe was formerly our primary distributor of food and paper
supplies to our U.S. stores.
(c) Adjusted for the two for one stock split on June 26, 2007. See Note 3 to the Consolidated Financial Statements.
(d) System sales growth includes the results of all restaurants regardless of ownership, including Company owned,
franchise, unconsolidated affiliate and license restaurants. Sales of franchise, unconsolidated affiliate and
license restaurants generate franchise and license fees for the Company (typically at a rate of 4% to 6% of sales).
Franchise, unconsolidated affiliate and license restaurant sales are not included in Company sales we present on
the Consolidated Statements of Income; however, the fees are included in the Company’s revenues. We believe
system sales growth is useful to investors as a significant indicator of the overall strength of our business as it
incorporates all our revenue drivers, Company and franchise same store sales as well as net unit development.
Same store sales growth includes the results of all restaurants that have been open one year or more.
Additionally, we began reporting information for our international business in two separate operating segments
(the International Division and the China Division) in 2005 as a result of changes in our management structure.
Segment information for periods prior to 2005 has been restated to reflect this reporting.
(e) Local currency represents the percentage change excluding the impact of foreign currency translation. These
amounts are derived by translating current year results at prior year average exchange rates. We believe the
elimination of the foreign currency translation impact provides better year-to-year comparability without the
distortion of foreign currency fluctuations.
Form 10-K