Pizza Hut 2008 Annual Report Download - page 217
Download and view the complete annual report
Please find page 217 of the 2008 Pizza Hut annual report below. You can navigate through the pages in the report by either clicking on the pages listed below, or by using the keyword search tool below to find specific information within the annual report.-
 1
1 -
2
-
3
-
4
-
5
-
6
-
7
-
8
-
9
-
10
-
11
-
12
-
13
-
14
-
15
-
16
-
17
-
18
-
19
-
20
-
21
-
22
-
23
-
24
-
25
-
26
-
27
-
28
-
29
-
30
-
31
-
32
-
33
-
34
-
35
-
36
-
37
-
38
-
39
-
40
-
41
-
42
-
43
-
44
-
45
-
46
-
47
-
48
-
49
-
50
-
51
-
52
-
53
-
54
-
55
-
56
-
57
-
58
-
59
-
60
-
61
-
62
-
63
-
64
-
65
-
66
-
67
-
68
-
69
-
70
-
71
-
72
-
73
-
74
-
75
-
76
-
77
-
78
-
79
-
80
-
81
-
82
-
83
-
84
-
85
-
86
-
87
-
88
-
89
-
90
-
91
-
92
-
93
-
94
-
95
-
96
-
97
-
98
-
99
-
100
-
101
-
102
-
103
-
104
-
105
-
106
-
107
-
108
-
109
-
110
-
111
-
112
-
113
-
114
-
115
-
116
-
117
-
118
-
119
-
120
-
121
-
122
-
123
-
124
-
125
-
126
-
127
-
128
-
129
-
130
-
131
-
132
-
133
-
134
-
135
-
136
-
137
-
138
-
139
-
140
-
141
-
142
-
143
-
144
-
145
-
146
-
147
-
148
-
149
-
150
-
151
-
152
-
153
-
154
-
155
-
156
-
157
-
158
-
159
-
160
-
161
-
162
-
163
-
164
-
165
-
166
-
167
-
168
-
169
-
170
-
171
-
172
-
173
-
174
-
175
-
176
-
177
-
178
-
179
-
180
-
181
-
182
-
183
-
184
-
185
-
186
-
187
-
188
-
189
-
190
-
191
-
192
-
193
-
194
-
195
-
196
-
197
-
198
-
199
-
200
-
201
-
202
-
203
-
204
-
205
-
206
-
 207
207 -
 208
208 -
 209
209 -
 210
210 -
 211
211 -
 212
212 -
 213
213 -
 214
214 -
 215
215 -
 216
216 -
 217
217 -
 218
218 -
 219
219 -
 220
220 -
 221
221 -
 222
222 -
 223
223 -
 224
224 -
 225
225 -
 226
226 -
 227
227 -
228
-
229
-
230
-
231
-
232
-
233
-
234
-
235
-
236
-
237
-
238
-
239
-
240
 |
 |

95
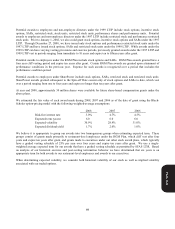
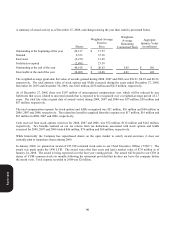
Our 2006 effective income tax rate was positively impacted by the reversal of tax reserves in connection with our regular
U.S. audit cycle as well as certain out-of-year adjustments to reserves and accruals that lowered our effective income tax
rate by 2.2 percentage points. The reversal of tax reserves was partially offset by valuation allowance additions on foreign
tax credits for which, as a result of the tax reserve reversals, we believed were not likely to be utilized before they expired.
We also recognized deferred tax assets for the foreign tax credit impact of non-recurring decisions to repatriate certain
foreign earnings in 2007. However, we provided full valuation allowances on such assets as we did not believe it was
more likely than not that they would be realized at that time.
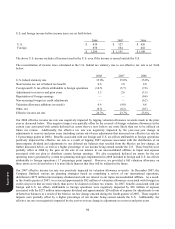
Adjustments to reserves and prior years include the effects of the reconciliation of income tax amounts recorded in our
Consolidated Statements of Income to amounts reflected on our tax returns, including any adjustments to the Consolidated
Balance Sheets. Adjustments to reserves and prior years also includes changes in tax reserves, including interest thereon,
established for potential exposure we may incur if a taxing authority takes a position on a matter contrary to our position.
We evaluate these reserves on a quarterly basis to insure that they have been appropriately adjusted for events, including
audit settlements that we believe may impact our exposure.
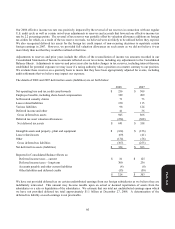
The details of 2008 and 2007 deferred tax assets (liabilities) are set forth below:
2008 2007
Net operating loss and tax credit carryforwards $ 256 $ 309
Employee benefits, including share-based compensation 329 209
Self-insured casualty claims 71 73
Lease related liabilities 150 115
Various liabilities 98 124
Deferred income and other 41 36
Gross deferred tax assets 945 866
Deferred tax asset valuation allowances (254) (308)
Net deferred tax assets $ 691 $ 558
Intangible assets and property, plant and equipment $ (164) $ (156)
Lease related assets (69) (41)
Other (134) (58)
Gross deferred tax liabilities (367) (255)
Net deferred tax assets (liabilities) $ 324 $ 303
Reported in Consolidated Balance Sheets as:
Deferred income taxes – current $ 81 $ 125
Deferred income taxes – long-term 300 236
Accounts payable and other current liabilities (4) (8)
Other liabilities and deferred credits (53) (50)
$ 324 $ 303
We have not provided deferred tax on certain undistributed earnings from our foreign subsidiaries as we believe they are
indefinitely reinvested. This amount may become taxable upon an actual or deemed repatriation of assets from the
subsidiaries or a sale or liquidation of the subsidiaries. We estimate that our total net undistributed earnings upon which
we have not provided deferred tax total approximately $1.1 billion at December 27, 2008. A determination of the
deferred tax liability on such earnings is not practicable.
Form 10-K