Pizza Hut 2008 Annual Report Download - page 77
Download and view the complete annual report
Please find page 77 of the 2008 Pizza Hut annual report below. You can navigate through the pages in the report by either clicking on the pages listed below, or by using the keyword search tool below to find specific information within the annual report.-
 1
1 -
2
-
3
-
4
-
5
-
6
-
7
-
8
-
9
-
10
-
11
-
12
-
13
-
14
-
15
-
16
-
17
-
18
-
19
-
20
-
21
-
22
-
23
-
24
-
25
-
26
-
27
-
28
-
29
-
30
-
31
-
32
-
33
-
34
-
35
-
36
-
37
-
38
-
39
-
40
-
41
-
42
-
43
-
44
-
45
-
46
-
47
-
48
-
49
-
50
-
51
-
52
-
53
-
54
-
55
-
56
-
57
-
58
-
59
-
60
-
61
-
62
-
63
-
64
-
65
-
66
-
 67
67 -
 68
68 -
 69
69 -
 70
70 -
 71
71 -
 72
72 -
 73
73 -
 74
74 -
 75
75 -
 76
76 -
 77
77 -
 78
78 -
 79
79 -
 80
80 -
 81
81 -
 82
82 -
 83
83 -
 84
84 -
 85
85 -
 86
86 -
 87
87 -
88
-
89
-
90
-
91
-
92
-
93
-
94
-
95
-
96
-
97
-
98
-
99
-
100
-
101
-
102
-
103
-
104
-
105
-
106
-
107
-
108
-
109
-
110
-
111
-
112
-
113
-
114
-
115
-
116
-
117
-
118
-
119
-
120
-
121
-
122
-
123
-
124
-
125
-
126
-
127
-
128
-
129
-
130
-
131
-
132
-
133
-
134
-
135
-
136
-
137
-
138
-
139
-
140
-
141
-
142
-
143
-
144
-
145
-
146
-
147
-
148
-
149
-
150
-
151
-
152
-
153
-
154
-
155
-
156
-
157
-
158
-
159
-
160
-
161
-
162
-
163
-
164
-
165
-
166
-
167
-
168
-
169
-
170
-
171
-
172
-
173
-
174
-
175
-
176
-
177
-
178
-
179
-
180
-
181
-
182
-
183
-
184
-
185
-
186
-
187
-
188
-
189
-
190
-
191
-
192
-
193
-
194
-
195
-
196
-
197
-
198
-
199
-
200
-
201
-
202
-
203
-
204
-
205
-
206
-
207
-
208
-
209
-
210
-
211
-
212
-
213
-
214
-
215
-
216
-
217
-
218
-
219
-
220
-
221
-
222
-
223
-
224
-
225
-
226
-
227
-
228
-
229
-
230
-
231
-
232
-
233
-
234
-
235
-
236
-
237
-
238
-
239
-
240
 |
 |

23MAR200920295069
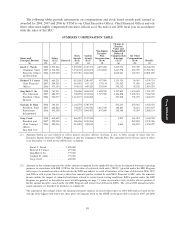
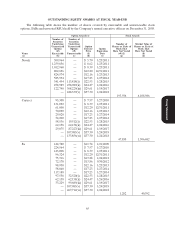
The following tables provide information on compensation and stock based awards paid, earned or
awarded for 2008, 2007 and 2006 by YUM to our Chief Executive Officer, Chief Financial Officer and our
three other most highly compensated executive officers as of the end of our 2008 fiscal year in accordance
with the rules of the SEC.
SUMMARY COMPENSATION TABLE
Change in
Pension
Value and
Non-Equity Nonqualified
Incentive Deferred
Stock Option Plan Compensation All Other
Name and Salary Awards Awards Compensation Earnings Compensation
Principal Position Year ($)(1) Bonus($) ($)(2) ($)(3) ($)(4) ($)(5) ($)(6) Total($)
(a) (b) (c) (d) (e) (f) (g) (h) (i)
David C. Novak 2008 1,393,846 — 3,070,690 4,345,579 4,057,200 5,255,931 239,709 18,362,955
Chairman, Chief 2007 1,312,308 — 3,354,572 4,257,692 4,742,892 1,647,578 203,939 15,518,981
Executive Officer 2006 1,215,000 — 3,355,718 4,082,240 — 2,069,631 169,310 10,891,899
and President
Richard T. Carucci 2008 669,231 — 815,188 1,248,447 497,980 1,131,924 36,963 4,399,733
Chief Financial 2007 590,385 — 561,093 835,113 379,134 251,902 71,580 2,689,207
Officer 2006 471,154 — 194,141 649,520 359,100 342,312 43,102 2,059,329
Jing-Shyh S. Su 2008 769,231 — 546,260 1,684,052 1,609,598 1,107,629 1,434,625 7,151,395
Vice Chairman, 2007 686,539 — 708,292 1,154,856 1,719,900 1,486,408 1,408,513 7,164,508
President, China 2006 523,077 — 1,163,137 1,044,288 — 493,258 378,475 3,602,235
Division
Graham D. Allan 2008 769,231 — 1,142,754 1,740,703 — 502,319 207,063 4,362,070
President, Yum! 2007 688,462 — 102,625 1,765,926 1,615,950 188,483 52,661 4,414,107
Restaurants 2006 542,308 — 193,271 1,004,983 897,600 182,588 47,389 2,868,139
International
Greg Creed 2008 612,692 — 866,057 1,317,940 — 3,203 361,012 3,160,904
President and 2007 525,000 — 556,046 1,230,086 — — 267,824 2,578,956
Proxy Statement
Chief Concept 2006 425,096 — 415,282 482,242 — 4,604 126,855 1,454,079
Officer,
Taco Bell U.S.
(1) Amounts shown are not reduced to reflect named executive officers’ elections, if any, to defer receipt of salary into the
Executive Income Deferral (‘‘EID’’) Program or into the Company’s 401(k) Plan. The annualized rates of base salary in effect
as of December 31, 2008 for the NEOs were as follows:
David C. Novak .......... 1,400,000
Richard T. Carucci ........ 675,000
Jing-Shyh S. Su .......... 775,000
Graham D. Allan ......... 775,000
Greg Creed ............. 620,000
(2) Amounts in this column represent the dollar amount recognized for the applicable fiscal years for financial statement reporting
purposes in accordance with FAS 123R for the fair value of restricted stock units (‘‘RSUs’’) granted under the EID Program
with respect to annual incentives deferred into the EID and subject to a risk of forfeiture at the time of deferral in 2008, 2007
and 2006 as well as prior fiscal years, rather than amounts paid or realized by each NEO. Pursuant to SEC rules, the amounts
shown exclude the impact of estimated forfeitures related to service-based vesting conditions. RSUs granted under the EID
Program are granted, as described in more detail beginning on page 71, when an executive elects to defer all or a portion of
his/her annual incentive award under the EID Program and invests that deferral in RSUs. The actual 2008 annual incentive
award amounts are described in footnotes to column (f).
The amounts in this column reflect the financial statement expense of awards with respect to 2003-2008 and are based on the
average of the highest and lowest per share price of Company stock on the NYSE on the grant date (except for 2007 and 2008
59