Pizza Hut 2008 Annual Report Download - page 159
Download and view the complete annual report
Please find page 159 of the 2008 Pizza Hut annual report below. You can navigate through the pages in the report by either clicking on the pages listed below, or by using the keyword search tool below to find specific information within the annual report.-
 1
1 -
2
-
3
-
4
-
5
-
6
-
7
-
8
-
9
-
10
-
11
-
12
-
13
-
14
-
15
-
16
-
17
-
18
-
19
-
20
-
21
-
22
-
23
-
24
-
25
-
26
-
27
-
28
-
29
-
30
-
31
-
32
-
33
-
34
-
35
-
36
-
37
-
38
-
39
-
40
-
41
-
42
-
43
-
44
-
45
-
46
-
47
-
48
-
49
-
50
-
51
-
52
-
53
-
54
-
55
-
56
-
57
-
58
-
59
-
60
-
61
-
62
-
63
-
64
-
65
-
66
-
67
-
68
-
69
-
70
-
71
-
72
-
73
-
74
-
75
-
76
-
77
-
78
-
79
-
80
-
81
-
82
-
83
-
84
-
85
-
86
-
87
-
88
-
89
-
90
-
91
-
92
-
93
-
94
-
95
-
96
-
97
-
98
-
99
-
100
-
101
-
102
-
103
-
104
-
105
-
106
-
107
-
108
-
109
-
110
-
111
-
112
-
113
-
114
-
115
-
116
-
117
-
118
-
119
-
120
-
121
-
122
-
123
-
124
-
125
-
126
-
127
-
128
-
129
-
130
-
131
-
132
-
133
-
134
-
135
-
136
-
137
-
138
-
139
-
140
-
141
-
142
-
143
-
144
-
145
-
146
-
147
-
148
-
 149
149 -
 150
150 -
 151
151 -
 152
152 -
 153
153 -
 154
154 -
 155
155 -
 156
156 -
 157
157 -
 158
158 -
 159
159 -
 160
160 -
 161
161 -
 162
162 -
 163
163 -
 164
164 -
 165
165 -
 166
166 -
 167
167 -
 168
168 -
 169
169 -
170
-
171
-
172
-
173
-
174
-
175
-
176
-
177
-
178
-
179
-
180
-
181
-
182
-
183
-
184
-
185
-
186
-
187
-
188
-
189
-
190
-
191
-
192
-
193
-
194
-
195
-
196
-
197
-
198
-
199
-
200
-
201
-
202
-
203
-
204
-
205
-
206
-
207
-
208
-
209
-
210
-
211
-
212
-
213
-
214
-
215
-
216
-
217
-
218
-
219
-
220
-
221
-
222
-
223
-
224
-
225
-
226
-
227
-
228
-
229
-
230
-
231
-
232
-
233
-
234
-
235
-
236
-
237
-
238
-
239
-
240
 |
 |

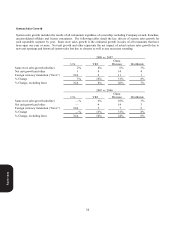
37
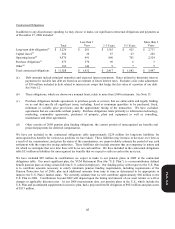
Company Restaurant Margins
2008
U.S. YRI
China
Division Worldwide
Company sales 100.0% 100.0% 100.0% 100.0%
Food and paper 30.3 31.6 37.7 32.9
Payroll and employee benefits 30.1 26.0 13.8 24.1
Occupancy and other operating expenses 27.1 31.3 30.1 29.0
Company restaurant margin 12.5% 11.1% 18.4% 14.0%
2007
U.S. YRI
China
Division Worldwide
Company sales 100.0% 100.0% 100.0% 100.0%
Food and paper 29.2 29.9 36.4 31.0
Payroll and employee benefits 30.5 26.1 13.2 25.3
Occupancy and other operating expenses 27.0 31.7 30.3 29.1
Company restaurant margin 13.3% 12.3% 20.1% 14.6%
2006
U.S. YRI
China
Division Worldwide
Company sales 100.0% 100.0% 100.0% 100.0%
Food and paper 28.2 32.2 35.4 30.5
Payroll and employee benefits 30.1 24.6 12.9 25.6
Occupancy and other operating expenses 27.1 31.0 31.3 28.7
Company restaurant margin 14.6% 12.2% 20.4% 15.2%
In 2008, the decrease in U.S. restaurant margin as a percentage of sales was driven by the impact of higher commodity
costs (primarily cheese, meat, chicken and wheat costs), higher labor costs (primarily wage rate and salary increases) and
higher property and casualty insurance expense as we lapped favorability recognized in 2007. The decrease was partially
offset by the favorable impact of same store sales growth on restaurant margin including the impact of higher average
guest check.
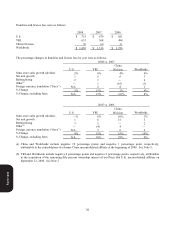
In 2007, the decrease in U.S. restaurant margin as a percentage of sales was driven by the impact of higher commodity
costs (primarily cheese and meats) and higher wage rates, due primarily to state minimum wage rate increases. The
decrease was partially offset by the favorable impact of lower self-insured property and casualty insurance expense driven
by improved loss trends, as well as the favorable impact on restaurant margin of refranchising and closing certain
restaurants.
In 2008, the decrease in YRI restaurant margin as a percentage of sales was driven by the elimination of a VAT
exemption in Mexico. An increase in commodity costs was partially offset by higher average guest check.
In 2007, the increase in YRI restaurant margin as a percentage of sales was driven by the impact of same store sales
growth on restaurant margin as well as the favorable impact of refranchising certain restaurants. The increase was almost
fully offset by higher labor costs (primarily wage rates) and the impact of lower margins associated with Pizza Hut units
in the U.K. which we now operate. As a percentage of sales, Pizza Hut U.K. restaurants negatively impacted payroll and
employee benefits and occupancy and other expenses and positively impacted food and paper.
Form 10-K