Pizza Hut 2008 Annual Report Download - page 61
Download and view the complete annual report
Please find page 61 of the 2008 Pizza Hut annual report below. You can navigate through the pages in the report by either clicking on the pages listed below, or by using the keyword search tool below to find specific information within the annual report.-
 1
1 -
2
-
3
-
4
-
5
-
6
-
7
-
8
-
9
-
10
-
11
-
12
-
13
-
14
-
15
-
16
-
17
-
18
-
19
-
20
-
21
-
22
-
23
-
24
-
25
-
26
-
27
-
28
-
29
-
30
-
31
-
32
-
33
-
34
-
35
-
36
-
37
-
38
-
39
-
40
-
41
-
42
-
43
-
44
-
45
-
46
-
47
-
48
-
49
-
50
-
 51
51 -
 52
52 -
 53
53 -
 54
54 -
 55
55 -
 56
56 -
 57
57 -
 58
58 -
 59
59 -
 60
60 -
 61
61 -
 62
62 -
 63
63 -
 64
64 -
 65
65 -
 66
66 -
 67
67 -
 68
68 -
 69
69 -
 70
70 -
 71
71 -
72
-
73
-
74
-
75
-
76
-
77
-
78
-
79
-
80
-
81
-
82
-
83
-
84
-
85
-
86
-
87
-
88
-
89
-
90
-
91
-
92
-
93
-
94
-
95
-
96
-
97
-
98
-
99
-
100
-
101
-
102
-
103
-
104
-
105
-
106
-
107
-
108
-
109
-
110
-
111
-
112
-
113
-
114
-
115
-
116
-
117
-
118
-
119
-
120
-
121
-
122
-
123
-
124
-
125
-
126
-
127
-
128
-
129
-
130
-
131
-
132
-
133
-
134
-
135
-
136
-
137
-
138
-
139
-
140
-
141
-
142
-
143
-
144
-
145
-
146
-
147
-
148
-
149
-
150
-
151
-
152
-
153
-
154
-
155
-
156
-
157
-
158
-
159
-
160
-
161
-
162
-
163
-
164
-
165
-
166
-
167
-
168
-
169
-
170
-
171
-
172
-
173
-
174
-
175
-
176
-
177
-
178
-
179
-
180
-
181
-
182
-
183
-
184
-
185
-
186
-
187
-
188
-
189
-
190
-
191
-
192
-
193
-
194
-
195
-
196
-
197
-
198
-
199
-
200
-
201
-
202
-
203
-
204
-
205
-
206
-
207
-
208
-
209
-
210
-
211
-
212
-
213
-
214
-
215
-
216
-
217
-
218
-
219
-
220
-
221
-
222
-
223
-
224
-
225
-
226
-
227
-
228
-
229
-
230
-
231
-
232
-
233
-
234
-
235
-
236
-
237
-
238
-
239
-
240
 |
 |

23MAR200920295069
Comparative Compensation Data—Messrs. Carucci, Su, Allan and Creed
Revenue size often correlates to some degree with the market value of compensation for senior
executive positions. For companies with significant franchise operations measuring size is more complex.
This is because there are added complexities and responsibilities for managing the relationships,
arrangements, and overall scope of the enterprise that franchising introduces, in particular, managing
product introductions, marketing, processes to drive sales growth and overall operations improvements
across the entire franchise system. Accordingly, the Compensation Committee decided, based on input
from Hewitt, to add 25% of franchisee and licensee sales to the Company’s 2007 Company sales of
$9.1 billion for purposes of determining the revenue scope for deriving the market value of various
components of compensation. This means that the Company, when considering franchisee sales, is viewed
as having revenues of approximately $15.2 billion. Specifically, this amount was determined by adding 2007
Company sales of $9.1 billion and 25% of franchisee and licensee sales (from which the Company derives
revenues in the form of royalties) of approximately $24.4 billion. In the case of Mr. Su, the Committee
determined, that due to the strategic importance of his individual contribution and the China Division’s
contribution to the Company, it was appropriate to select a Hewitt comparator group with significantly
higher revenue.
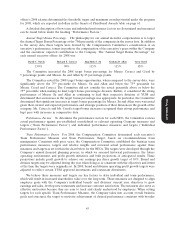
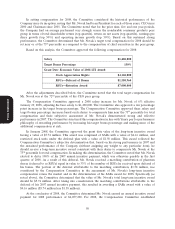
The survey data for each NEO’s job was derived from Hewitt survey data and Towers Perrin survey
data and is summarized for each of our NEOs below:
Hewitt Towers Perrin
Number of Median Number of Median
Annual Revenue Range companies Revenues Annual Revenue Range companies Revenues
Carucci ..... $10-25 billion Corporate 55 $13.2 billion $10-20 billion Corporate 64 $ 14 billion
Su......... $5-10 billion Group 44 $ 7 billion >$2 billion Group 113 $4.8 billion
Allan ....... $5-10 billion Group 44 $ 7 billion >$2 billion Group 113 $4.8 billion
Creed ...... $2.5-5 billion Group 75 $ 3.5 billion >$2 billion Group 113 $4.8 billion
Companies included in the Survey Data for Messrs. Carucci, Su, Allan and Creed
In accordance with SEC rules, a list of the companies included in the survey data is attached at
Proxy Statement
Appendices 1 through 4. Consistent with prior years, the Committee did not consider compensation data
from any specific company in the survey data.
When providing survey data for the job surveyed, the consulting firms draw data from some, but not
all, of the companies in the list. This is because some companies in the group may not have a matching or
similar job to the job being surveyed. The consulting firm data does not disclose the name of the
companies that comprise the smaller group of companies for purposes of each job surveyed. Therefore, we
disclose in Appendices 1 and 2 the names of all of the companies in the survey group and have disclosed in
the table above the number of companies used and median revenues of those companies in the survey data
for the job surveyed for each executive.
Targeting Compensation
For the NEOs, other than Mr. Novak, we target the elements of our compensation program as
follows:
• Base salary—because NEOs are expected to make significant contributions in current and future
positions and would be considered a critical loss if they left the Company, we target the
75th percentile for base salary
• Performance-based annual incentive compensation—75th percentile to emphasize superior pay for
superior performance
• Long-term incentives—50th percentile
43