Pizza Hut 2008 Annual Report Download - page 165
Download and view the complete annual report
Please find page 165 of the 2008 Pizza Hut annual report below. You can navigate through the pages in the report by either clicking on the pages listed below, or by using the keyword search tool below to find specific information within the annual report.-
 1
1 -
2
-
3
-
4
-
5
-
6
-
7
-
8
-
9
-
10
-
11
-
12
-
13
-
14
-
15
-
16
-
17
-
18
-
19
-
20
-
21
-
22
-
23
-
24
-
25
-
26
-
27
-
28
-
29
-
30
-
31
-
32
-
33
-
34
-
35
-
36
-
37
-
38
-
39
-
40
-
41
-
42
-
43
-
44
-
45
-
46
-
47
-
48
-
49
-
50
-
51
-
52
-
53
-
54
-
55
-
56
-
57
-
58
-
59
-
60
-
61
-
62
-
63
-
64
-
65
-
66
-
67
-
68
-
69
-
70
-
71
-
72
-
73
-
74
-
75
-
76
-
77
-
78
-
79
-
80
-
81
-
82
-
83
-
84
-
85
-
86
-
87
-
88
-
89
-
90
-
91
-
92
-
93
-
94
-
95
-
96
-
97
-
98
-
99
-
100
-
101
-
102
-
103
-
104
-
105
-
106
-
107
-
108
-
109
-
110
-
111
-
112
-
113
-
114
-
115
-
116
-
117
-
118
-
119
-
120
-
121
-
122
-
123
-
124
-
125
-
126
-
127
-
128
-
129
-
130
-
131
-
132
-
133
-
134
-
135
-
136
-
137
-
138
-
139
-
140
-
141
-
142
-
143
-
144
-
145
-
146
-
147
-
148
-
149
-
150
-
151
-
152
-
153
-
154
-
 155
155 -
 156
156 -
 157
157 -
 158
158 -
 159
159 -
 160
160 -
 161
161 -
 162
162 -
 163
163 -
 164
164 -
 165
165 -
 166
166 -
 167
167 -
 168
168 -
 169
169 -
 170
170 -
 171
171 -
 172
172 -
 173
173 -
 174
174 -
 175
175 -
176
-
177
-
178
-
179
-
180
-
181
-
182
-
183
-
184
-
185
-
186
-
187
-
188
-
189
-
190
-
191
-
192
-
193
-
194
-
195
-
196
-
197
-
198
-
199
-
200
-
201
-
202
-
203
-
204
-
205
-
206
-
207
-
208
-
209
-
210
-
211
-
212
-
213
-
214
-
215
-
216
-
217
-
218
-
219
-
220
-
221
-
222
-
223
-
224
-
225
-
226
-
227
-
228
-
229
-
230
-
231
-
232
-
233
-
234
-
235
-
236
-
237
-
238
-
239
-
240
 |
 |

43
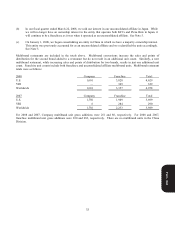
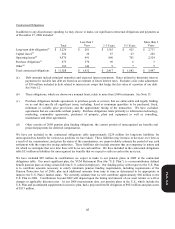
During 2008 our Shareholders’ Equity decreased approximately $1.2 billion resulting in the Company ending the year
with a Shareholders’ Deficit. This decrease was primarily driven by our shareholder payouts of approximately $2 billion
through share buybacks and dividends, a decline in the unrecognized funded status of our U.S. pension plans of
approximately $200 million and approximately $200 million of foreign currency translation adjustments during the year
due to the strengthening of the U.S. Dollar. These declines were partially offset by the Company’s Net income for the
year ended December 27, 2008. A recorded Shareholders’ Deficit under generally accepted accounting principles does
not by itself preclude us from paying dividends to our shareholders or repurchasing shares of our Common Stock.
Liquidity and Capital Resources
Operating in the QSR industry allows us to generate substantial cash flows from the operations of our company stores and
from our substantial franchise operations which require a limited YUM investment. In each of the last seven fiscal years,
net cash provided by operating activities has exceeded $1.1 billion. We expect these levels of net cash provided by
operating activities to continue in the foreseeable future. Additionally, we estimate that refranchising proceeds, prior to
income taxes, will total at least $250 million in 2009. However, unforeseen downturns in our business could adversely
impact our cash flows from operations from the levels historically realized or our refranchising proceeds from those
amounts expected.
In the event our cash flows are negatively impacted by business downturns, we believe we have the ability to temporarily
reduce our discretionary spending without significant impact to our long-term business prospects. Our discretionary
spending includes capital spending for new restaurants, acquisitions of restaurants from franchisees, repurchases of shares
of our Common Stock and dividends paid to our shareholders. Additionally, as of December, 2008 we had approximately
$1 billion in unused capacity under revolving credit facilities that expire in 2012. Given this available borrowing capacity
under our credit facilities, our debt maturity schedule and our ability to reduce discretionary spending, we do not believe
we will need to access the credit markets during 2009. To help ensure that we do not need to access the credit markets
while continuing to build our liquidity and maintaining our financial flexibility, we do not currently plan to repurchase
shares in 2009.
Additionally, we are managing our cash and debt positions in order to maintain our current investment grade ratings from
Standard & Poor’s Rating Services (BBB-) and Moody’s Investors Service (Baa3). A downgrade of our credit rating
would increase the Company’s current borrowing costs and could impact the Company’s ability to access the credit
markets if necessary. Based on the amount and composition of our debt at December 27, 2008 our interest expense would
increase approximately $1.3 million on a full year basis should we receive a one-level downgrade in our ratings.
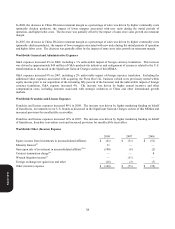
Discretionary Spending
During 2008, we invested $935 million in our businesses, including approximately $355 million in the U.S., $260 million
for the International Division and $320 million for the China Division. For 2009, we estimate capital spending will be
approximately $900 million.
We returned approximately $2 billion to our shareholders through share repurchases and quarterly dividends in 2008.
This is the fourth straight year that we returned over $1.1 billion to our shareholders. Under the authority of our Board of
Directors, we repurchased 46.8 million shares of our Common Stock for $1.6 billion during 2008. As mentioned above,
the Company does not currently plan to repurchase shares during 2009.
During the year ended December 27, 2008, we paid cash dividends of $322 million. Additionally, on November 21, 2008
our Board of Directors approved cash dividends of $.19 per share of Common Stock to be distributed on February 6, 2009
to shareholders of record at the close of business on January 16, 2009. The Company is targeting an ongoing annual
dividend payout ratio of 35% - 40% of net income.
Form 10-K