Pizza Hut 2008 Annual Report Download - page 81
Download and view the complete annual report
Please find page 81 of the 2008 Pizza Hut annual report below. You can navigate through the pages in the report by either clicking on the pages listed below, or by using the keyword search tool below to find specific information within the annual report.-
 1
1 -
2
-
3
-
4
-
5
-
6
-
7
-
8
-
9
-
10
-
11
-
12
-
13
-
14
-
15
-
16
-
17
-
18
-
19
-
20
-
21
-
22
-
23
-
24
-
25
-
26
-
27
-
28
-
29
-
30
-
31
-
32
-
33
-
34
-
35
-
36
-
37
-
38
-
39
-
40
-
41
-
42
-
43
-
44
-
45
-
46
-
47
-
48
-
49
-
50
-
51
-
52
-
53
-
54
-
55
-
56
-
57
-
58
-
59
-
60
-
61
-
62
-
63
-
64
-
65
-
66
-
67
-
68
-
69
-
70
-
 71
71 -
 72
72 -
 73
73 -
 74
74 -
 75
75 -
 76
76 -
 77
77 -
 78
78 -
 79
79 -
 80
80 -
 81
81 -
 82
82 -
 83
83 -
 84
84 -
 85
85 -
 86
86 -
 87
87 -
 88
88 -
 89
89 -
 90
90 -
 91
91 -
92
-
93
-
94
-
95
-
96
-
97
-
98
-
99
-
100
-
101
-
102
-
103
-
104
-
105
-
106
-
107
-
108
-
109
-
110
-
111
-
112
-
113
-
114
-
115
-
116
-
117
-
118
-
119
-
120
-
121
-
122
-
123
-
124
-
125
-
126
-
127
-
128
-
129
-
130
-
131
-
132
-
133
-
134
-
135
-
136
-
137
-
138
-
139
-
140
-
141
-
142
-
143
-
144
-
145
-
146
-
147
-
148
-
149
-
150
-
151
-
152
-
153
-
154
-
155
-
156
-
157
-
158
-
159
-
160
-
161
-
162
-
163
-
164
-
165
-
166
-
167
-
168
-
169
-
170
-
171
-
172
-
173
-
174
-
175
-
176
-
177
-
178
-
179
-
180
-
181
-
182
-
183
-
184
-
185
-
186
-
187
-
188
-
189
-
190
-
191
-
192
-
193
-
194
-
195
-
196
-
197
-
198
-
199
-
200
-
201
-
202
-
203
-
204
-
205
-
206
-
207
-
208
-
209
-
210
-
211
-
212
-
213
-
214
-
215
-
216
-
217
-
218
-
219
-
220
-
221
-
222
-
223
-
224
-
225
-
226
-
227
-
228
-
229
-
230
-
231
-
232
-
233
-
234
-
235
-
236
-
237
-
238
-
239
-
240
 |
 |

23MAR200920295069
Proxy Statement
63
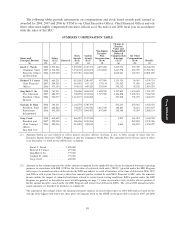
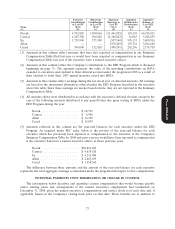
GRANTS OF PLAN-BASED AWARDS
The following table provides information on stock appreciation rights and restricted stock units granted for 2008 to each of the Company’s
named executive officers. The amount of these awards that were expensed is shown in the Summary Compensation Table at page 59.
All Other
Stock Awards: All Other
Estimated Future Payouts Under Number of Option/SAR Awards: Exercise or Grant Date
Non-Equity Incentive Plan Awards(1) Shares of Number of Securities Base Price of Fair Value of
Threshold Target Maximum Stock or Underlying Option/SAR Stock and
Name Grant Date ($) ($) ($) Units (#)(2) Options (#)(3) Awards ($/Sh)(4) Options Awards(5)
(a) (b) (c) (d) (e) (f) (g) (h) (i)
Novak 1/24/2008 0 2,100,000 6,300,000
1/24/2008 428,339 37.30 4,711,772
1/24/2008 187,398 37.30 6,989,945
2/5/2009 180,982 5,300,965
Carucci 1/24/2008 0 607,500 1,822,500
1/24/2008 240,941 37.30 2,650,375
2/5/2009 28,851 845,057
Su 1/24/2008 0 891,250 2,673,750
1/24/2008 374,797 37.30 4,122,804
2/5/2009 73,272 2,146,131
Allan 1/24/2008 0 891,250 2,673,750
1/24/2008 160,628 37.30 1,766,924
2/5/2009 89,460 2,620,275
Creed 1/24/2008 0 527,000 1,581,000
1/24/2008 107,085 37.30 1,177,946
2/5/2009 41,311 1,209,992
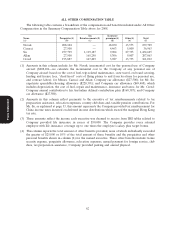
(1) Amounts in columns (c), (d) and (e) provide the minimum amount, target amount and maximum amounts payable as annual incentive
compensation under the YUM! Leaders’ Bonus Program based on the Company’s performance and on each executive’s individual
performance during 2008. The actual amount of annual incentive compensation awarded for 2008 is shown in the footnotes to column (f) of
the Summary Compensation Table on page 60. The performance measurements, performance targets, and target bonus percentage are
described in the Compensation Discussion and Analysis beginning on page 44 under the discussion of annual incentive compensation.