Pizza Hut 2008 Annual Report Download - page 63
Download and view the complete annual report
Please find page 63 of the 2008 Pizza Hut annual report below. You can navigate through the pages in the report by either clicking on the pages listed below, or by using the keyword search tool below to find specific information within the annual report.-
 1
1 -
2
-
3
-
4
-
5
-
6
-
7
-
8
-
9
-
10
-
11
-
12
-
13
-
14
-
15
-
16
-
17
-
18
-
19
-
20
-
21
-
22
-
23
-
24
-
25
-
26
-
27
-
28
-
29
-
30
-
31
-
32
-
33
-
34
-
35
-
36
-
37
-
38
-
39
-
40
-
41
-
42
-
43
-
44
-
45
-
46
-
47
-
48
-
49
-
50
-
51
-
52
-
 53
53 -
 54
54 -
 55
55 -
 56
56 -
 57
57 -
 58
58 -
 59
59 -
 60
60 -
 61
61 -
 62
62 -
 63
63 -
 64
64 -
 65
65 -
 66
66 -
 67
67 -
 68
68 -
 69
69 -
 70
70 -
 71
71 -
 72
72 -
 73
73 -
74
-
75
-
76
-
77
-
78
-
79
-
80
-
81
-
82
-
83
-
84
-
85
-
86
-
87
-
88
-
89
-
90
-
91
-
92
-
93
-
94
-
95
-
96
-
97
-
98
-
99
-
100
-
101
-
102
-
103
-
104
-
105
-
106
-
107
-
108
-
109
-
110
-
111
-
112
-
113
-
114
-
115
-
116
-
117
-
118
-
119
-
120
-
121
-
122
-
123
-
124
-
125
-
126
-
127
-
128
-
129
-
130
-
131
-
132
-
133
-
134
-
135
-
136
-
137
-
138
-
139
-
140
-
141
-
142
-
143
-
144
-
145
-
146
-
147
-
148
-
149
-
150
-
151
-
152
-
153
-
154
-
155
-
156
-
157
-
158
-
159
-
160
-
161
-
162
-
163
-
164
-
165
-
166
-
167
-
168
-
169
-
170
-
171
-
172
-
173
-
174
-
175
-
176
-
177
-
178
-
179
-
180
-
181
-
182
-
183
-
184
-
185
-
186
-
187
-
188
-
189
-
190
-
191
-
192
-
193
-
194
-
195
-
196
-
197
-
198
-
199
-
200
-
201
-
202
-
203
-
204
-
205
-
206
-
207
-
208
-
209
-
210
-
211
-
212
-
213
-
214
-
215
-
216
-
217
-
218
-
219
-
220
-
221
-
222
-
223
-
224
-
225
-
226
-
227
-
228
-
229
-
230
-
231
-
232
-
233
-
234
-
235
-
236
-
237
-
238
-
239
-
240
 |
 |

23MAR200920295069
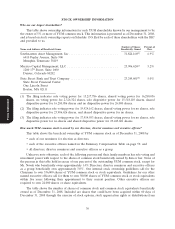
officer’s 2008 salaries determined the threshold, target and maximum awards potential under the program
for 2008, which are reported in dollars in the Grants of Plan-Based Awards table on page 63.
A detailed description of how team and individual performance factors are determined and measured
can be found below under the heading ‘‘Performance Factors.’’
Annual Target Bonus Percentage. The philosophy for our annual incentive compensation is to target
the Annual Target Bonus Percentage at the 75th percentile of the companies in the survey data. In addition
to the survey data, these targets were derived by the Compensation Committee’s consideration of an
executive’s performance, tenure in position, the compensation of the executive’s peers within the Company
and the executives’ expected contribution to the Company. The ‘‘Annual Target Bonus Percentage’’ for
each named executive officer for 2008 was:
David C. Novak Richard T. Carucci Jing-Shyh S. Su Graham D. Allan Greg Creed
150% 90% 115% 115% 85%
The Committee increased the 2008 target bonus percentage for Messrs. Carucci and Creed by
5 percentage points and Messrs. Su and Allan by 25 percentage points.
The Committee noted the 2008 target bonus opportunities, when compared to the survey data, were
significantly above the 75th percentile for Messrs. Su and Allan and below the 75th percentile for
Messrs. Creed and Carucci. The Committee did not consider the actual percentile above or below the
75th percentile when making its final target bonus percentages decision. Rather, it considered the strong
performance of Messrs. Su and Allan in continuing to lead their respective divisions of YUM and
determined that an increase in the target bonus percentage was appropriate. In particular, the Committee
determined that significant increases in target bonus percentage for Messrs. Su and Allan were warranted
given their current and expected performance and strategic position of their divisions in the growth of the
company. Mr. Carucci’s and Mr. Creed’s target bonus increases recognized their strong performance and
kept pace with increases in comparative data.
Performance Factors. To determine the performance factors for each NEO, the Committee reviews
actual performance against pre-established consolidated or relevant operating Company measures and
Proxy Statement
targets (‘‘Team Performance Factor’’) and individual performance measures and targets (‘‘Individual
Performance Factor’’).
Team Performance Factor. For 2008, the Compensation Committee determined each executive’s
Team Performance Measure and Team Performance Target, based on recommendations from
management. Consistent with prior years, the Compensation Committee established the business team
performance measures, targets and relative weights and reviewed actual performance against these
measures and targets as set forth in the chart below for the NEOs. The targets were developed through the
Company’s annual financial planning process, in which we assessed historical performance, the future
operating environment, and profit growth initiatives and built projections of anticipated results. These
projections include profit growth to achieve our earnings per share growth target of 10%. Brand and
division targets may be adjusted during the year when doing so is consistent with the objectives and intent
at the time the targets were originally set. In 2008, brand and division operating profit growth targets were
adjusted to reflect certain YUM approved investments and restaurant divestitures.
We believe these measures and targets are key factors to drive individual and team performance,
which will result in increased shareholder value over the long term. These measures are designed to align
employee goals with the Company’s individual brands’ and divisions’ current year objectives to grow
earnings and sales, develop new restaurants and increase customer satisfaction. The measures also serve as
effective motivation because they are easy to track and clearly understood by employees. When setting
targets for each specific Team Performance Measure, the Company takes into account overall business
goals and structures the target to motivate achievement of desired performance consistent with broader
45