Pizza Hut 2008 Annual Report Download - page 65
Download and view the complete annual report
Please find page 65 of the 2008 Pizza Hut annual report below. You can navigate through the pages in the report by either clicking on the pages listed below, or by using the keyword search tool below to find specific information within the annual report.-
 1
1 -
2
-
3
-
4
-
5
-
6
-
7
-
8
-
9
-
10
-
11
-
12
-
13
-
14
-
15
-
16
-
17
-
18
-
19
-
20
-
21
-
22
-
23
-
24
-
25
-
26
-
27
-
28
-
29
-
30
-
31
-
32
-
33
-
34
-
35
-
36
-
37
-
38
-
39
-
40
-
41
-
42
-
43
-
44
-
45
-
46
-
47
-
48
-
49
-
50
-
51
-
52
-
53
-
54
-
 55
55 -
 56
56 -
 57
57 -
 58
58 -
 59
59 -
 60
60 -
 61
61 -
 62
62 -
 63
63 -
 64
64 -
 65
65 -
 66
66 -
 67
67 -
 68
68 -
 69
69 -
 70
70 -
 71
71 -
 72
72 -
 73
73 -
 74
74 -
 75
75 -
76
-
77
-
78
-
79
-
80
-
81
-
82
-
83
-
84
-
85
-
86
-
87
-
88
-
89
-
90
-
91
-
92
-
93
-
94
-
95
-
96
-
97
-
98
-
99
-
100
-
101
-
102
-
103
-
104
-
105
-
106
-
107
-
108
-
109
-
110
-
111
-
112
-
113
-
114
-
115
-
116
-
117
-
118
-
119
-
120
-
121
-
122
-
123
-
124
-
125
-
126
-
127
-
128
-
129
-
130
-
131
-
132
-
133
-
134
-
135
-
136
-
137
-
138
-
139
-
140
-
141
-
142
-
143
-
144
-
145
-
146
-
147
-
148
-
149
-
150
-
151
-
152
-
153
-
154
-
155
-
156
-
157
-
158
-
159
-
160
-
161
-
162
-
163
-
164
-
165
-
166
-
167
-
168
-
169
-
170
-
171
-
172
-
173
-
174
-
175
-
176
-
177
-
178
-
179
-
180
-
181
-
182
-
183
-
184
-
185
-
186
-
187
-
188
-
189
-
190
-
191
-
192
-
193
-
194
-
195
-
196
-
197
-
198
-
199
-
200
-
201
-
202
-
203
-
204
-
205
-
206
-
207
-
208
-
209
-
210
-
211
-
212
-
213
-
214
-
215
-
216
-
217
-
218
-
219
-
220
-
221
-
222
-
223
-
224
-
225
-
226
-
227
-
228
-
229
-
230
-
231
-
232
-
233
-
234
-
235
-
236
-
237
-
238
-
239
-
240
 |
 |

23MAR200920295069
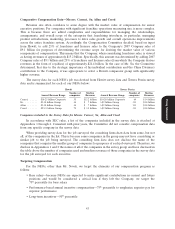
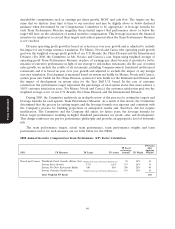
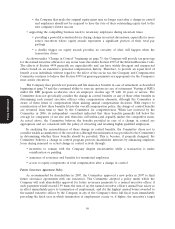
Su Division Operating Profit Growth 18.0% 14.0% 60 50% 30
System Sales Growth 19.0% 20.5% 134 20% 27
System Gross New Builds 450 571 200 20% 40
System Customer Satisfaction 68.0% 71.4% 150 10% 15
Total Weighted TP Factor 112
75% Division/25% Yum TP Factor 119
Chairman’s Incentive—Additional
Points 10
Final TP Factor 129
Chairman’s Incentive of 10 additional percentage bonus points was awarded to the China Division
for their leadership of the system in achieving breakthrough results
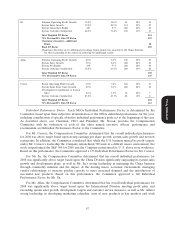
Allan Division Operating Profit Growth 8.0% 8.0% 100 50% 50
System Sales Growth 5.0% 8.2% 200 20% 40
System Net Builds 430 573 200 20% 40
System Customer Satisfaction 38.0% 43.2% 200 10% 20
Total Weighted TP Factor 150
75% Division/25% Yum TP Factor 147
Creed Brand Operating Profit Growth 5.0% 7.6% 126 50% 63
System Same Store Sales Growth 2.0% 8.5% 200 20% 40
Development Contribution to System
Sales 2.6% 1.9% 36 20% 7
System Customer Satisfaction 85.0% 83.5% 82 10% 8
Total Weighted TP Factor 118
75% Division/25% Yum TP Factor 123
Individual Performance Factor. Each NEOs Individual Performance Factor is determined by the
Committee based upon their subjective determination of the NEOs individual performance for the year,
including consideration of specific objective individual performance goals set at the beginning of the year.
As described above, our Chairman, CEO and President, Mr. Novak, provides the Compensation
Proxy Statement
Committee with his evaluation of each of the other named executive officers’ performance and
recommends an Individual Performance Factor to the Committee.
For Mr. Carucci, the Compensation Committee determined that his overall individual performance
for 2008 was above target based upon strong earnings per share growth, system sales growth and net new
restaurants. In addition, the Committee considered that, while the U.S. business missed its profit targets,
under Mr. Carucci’s leadership the Company refranchised 700 units in a difficult macro environment, the
stock outperformed the S&P 500 for 2008 and the Company restructured its U .S. above store workforce.
Based on this performance, the Committee approved a 135 Individual Performance Factor for Mr. Carucci.
For Mr. Su, the Compensation Committee determined that his overall individual performance for
2008 was significantly above target based upon the China Division significantly surpassing its system sales
growth and development plans, as well as Mr. Su’s strong leadership in managing the China business
through commodity inflation and the impact of the slowing macro economic environment, managing
vendor relationships to increase poultry capacity to meet increased demand and the introduction of
successful new products. Based on this performance, the Committee approved a 140 Individual
Performance Factor for Mr. Su.
For Mr. Allan, the Compensation Committee determined that his overall individual performance for
2008 was significantly above target based upon the International Division meeting profit plan, and
exceeding system sales growth, development targets and customer service measures, as well as Mr. Allan’s
strong leadership in developing marketing calendars, tests of new products in key markets and work
47