Pizza Hut 2008 Annual Report Download - page 211
Download and view the complete annual report
Please find page 211 of the 2008 Pizza Hut annual report below. You can navigate through the pages in the report by either clicking on the pages listed below, or by using the keyword search tool below to find specific information within the annual report.-
 1
1 -
2
-
3
-
4
-
5
-
6
-
7
-
8
-
9
-
10
-
11
-
12
-
13
-
14
-
15
-
16
-
17
-
18
-
19
-
20
-
21
-
22
-
23
-
24
-
25
-
26
-
27
-
28
-
29
-
30
-
31
-
32
-
33
-
34
-
35
-
36
-
37
-
38
-
39
-
40
-
41
-
42
-
43
-
44
-
45
-
46
-
47
-
48
-
49
-
50
-
51
-
52
-
53
-
54
-
55
-
56
-
57
-
58
-
59
-
60
-
61
-
62
-
63
-
64
-
65
-
66
-
67
-
68
-
69
-
70
-
71
-
72
-
73
-
74
-
75
-
76
-
77
-
78
-
79
-
80
-
81
-
82
-
83
-
84
-
85
-
86
-
87
-
88
-
89
-
90
-
91
-
92
-
93
-
94
-
95
-
96
-
97
-
98
-
99
-
100
-
101
-
102
-
103
-
104
-
105
-
106
-
107
-
108
-
109
-
110
-
111
-
112
-
113
-
114
-
115
-
116
-
117
-
118
-
119
-
120
-
121
-
122
-
123
-
124
-
125
-
126
-
127
-
128
-
129
-
130
-
131
-
132
-
133
-
134
-
135
-
136
-
137
-
138
-
139
-
140
-
141
-
142
-
143
-
144
-
145
-
146
-
147
-
148
-
149
-
150
-
151
-
152
-
153
-
154
-
155
-
156
-
157
-
158
-
159
-
160
-
161
-
162
-
163
-
164
-
165
-
166
-
167
-
168
-
169
-
170
-
171
-
172
-
173
-
174
-
175
-
176
-
177
-
178
-
179
-
180
-
181
-
182
-
183
-
184
-
185
-
186
-
187
-
188
-
189
-
190
-
191
-
192
-
193
-
194
-
195
-
196
-
197
-
198
-
199
-
200
-
 201
201 -
 202
202 -
 203
203 -
 204
204 -
 205
205 -
 206
206 -
 207
207 -
 208
208 -
 209
209 -
 210
210 -
 211
211 -
 212
212 -
 213
213 -
 214
214 -
 215
215 -
 216
216 -
 217
217 -
 218
218 -
 219
219 -
 220
220 -
 221
221 -
222
-
223
-
224
-
225
-
226
-
227
-
228
-
229
-
230
-
231
-
232
-
233
-
234
-
235
-
236
-
237
-
238
-
239
-
240
 |
 |

89
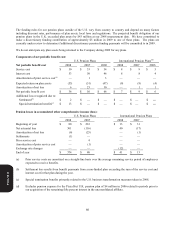
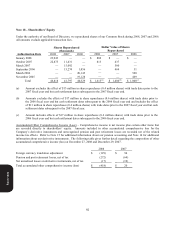
Potential awards to employees and non-employee directors under the 1999 LTIP include stock options, incentive stock
options, SARs, restricted stock, stock units, restricted stock units, performance shares and performance units. Potential
awards to employees and non-employee directors under the 1997 LTIP include restricted stock and performance restricted
stock units. Prior to January 1, 2002, we also could grant stock options, incentive stock options and SARs under the 1997
LTIP. Through December 27, 2008, we have issued only stock options and performance restricted stock units under the
1997 LTIP and have issued stock options, SARs and restricted stock units under the 1999 LTIP. While awards under the
1999 LTIP can have varying vesting provisions and exercise periods, previously granted awards under the 1997 LTIP and
1999 LTIP vest in periods ranging from immediate to 10 years and expire ten to fifteen years after grant.
Potential awards to employees under the RGM Plan include stock options and SARs. RGM Plan awards granted have a
four year cliff vesting period and expire ten years after grant. Certain RGM Plan awards are granted upon attainment of
performance conditions in the previous year. Expense for such awards is recognized over a period that includes the
performance condition period.
Potential awards to employees under SharePower include stock options, SARs, restricted stock and restricted stock units.
SharePower awards granted subsequent to the Spin-off Date consist only of stock options and SARs to date, which vest
over a period ranging from one to four years and expire no longer than ten years after grant.
At year end 2008, approximately 30 million shares were available for future share-based compensation grants under the
above plans.
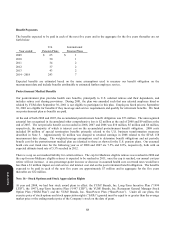
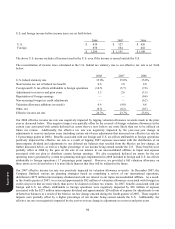
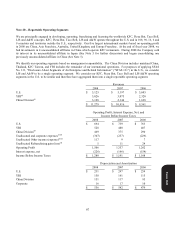
We estimated the fair value of each award made during 2008, 2007 and 2006 as of the date of grant using the Black-
Scholes option-pricing model with the following weighted-average assumptions:
2008 2007 2006
Risk-free interest rate 3.0% 4.7% 4.5%
Expected term (years) 6.0 6.0 6.0
Expected volatility 30.9% 28.9% 31.0%
Expected dividend yield 1.7% 2.0% 1.0%
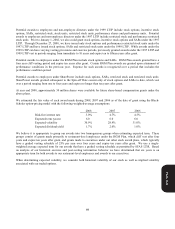
We believe it is appropriate to group our awards into two homogeneous groups when estimating expected term. These
groups consist of grants made primarily to restaurant-level employees under the RGM Plan, which cliff vest after four
years and expire ten years after grant, and grants made to executives under our other stock award plans, which typically
have a graded vesting schedule of 25% per year over four years and expire ten years after grant. We use a single-
weighted average expected term for our awards that have a graded vesting schedule as permitted by SFAS 123R. Based
on analysis of our historical exercise and post-vesting termination behavior we have determined that six years is an
appropriate term for both awards to our restaurant-level employees and awards to our executives.
When determining expected volatility, we consider both historical volatility of our stock as well as implied volatility
associated with our traded options.
Form 10-K