Pizza Hut 2008 Annual Report Download - page 54
Download and view the complete annual report
Please find page 54 of the 2008 Pizza Hut annual report below. You can navigate through the pages in the report by either clicking on the pages listed below, or by using the keyword search tool below to find specific information within the annual report.-
 1
1 -
2
-
3
-
4
-
5
-
6
-
7
-
8
-
9
-
10
-
11
-
12
-
13
-
14
-
15
-
16
-
17
-
18
-
19
-
20
-
21
-
22
-
23
-
24
-
25
-
26
-
27
-
28
-
29
-
30
-
31
-
32
-
33
-
34
-
35
-
36
-
37
-
38
-
39
-
40
-
41
-
42
-
43
-
 44
44 -
 45
45 -
 46
46 -
 47
47 -
 48
48 -
 49
49 -
 50
50 -
 51
51 -
 52
52 -
 53
53 -
 54
54 -
 55
55 -
 56
56 -
 57
57 -
 58
58 -
 59
59 -
 60
60 -
 61
61 -
 62
62 -
 63
63 -
 64
64 -
65
-
66
-
67
-
68
-
69
-
70
-
71
-
72
-
73
-
74
-
75
-
76
-
77
-
78
-
79
-
80
-
81
-
82
-
83
-
84
-
85
-
86
-
87
-
88
-
89
-
90
-
91
-
92
-
93
-
94
-
95
-
96
-
97
-
98
-
99
-
100
-
101
-
102
-
103
-
104
-
105
-
106
-
107
-
108
-
109
-
110
-
111
-
112
-
113
-
114
-
115
-
116
-
117
-
118
-
119
-
120
-
121
-
122
-
123
-
124
-
125
-
126
-
127
-
128
-
129
-
130
-
131
-
132
-
133
-
134
-
135
-
136
-
137
-
138
-
139
-
140
-
141
-
142
-
143
-
144
-
145
-
146
-
147
-
148
-
149
-
150
-
151
-
152
-
153
-
154
-
155
-
156
-
157
-
158
-
159
-
160
-
161
-
162
-
163
-
164
-
165
-
166
-
167
-
168
-
169
-
170
-
171
-
172
-
173
-
174
-
175
-
176
-
177
-
178
-
179
-
180
-
181
-
182
-
183
-
184
-
185
-
186
-
187
-
188
-
189
-
190
-
191
-
192
-
193
-
194
-
195
-
196
-
197
-
198
-
199
-
200
-
201
-
202
-
203
-
204
-
205
-
206
-
207
-
208
-
209
-
210
-
211
-
212
-
213
-
214
-
215
-
216
-
217
-
218
-
219
-
220
-
221
-
222
-
223
-
224
-
225
-
226
-
227
-
228
-
229
-
230
-
231
-
232
-
233
-
234
-
235
-
236
-
237
-
238
-
239
-
240
 |
 |

23MAR200920294881
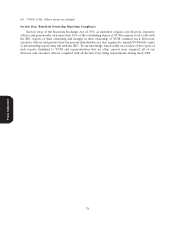
STOCK OWNERSHIP INFORMATION
Who are our largest shareholders?
This table shows ownership information for each YUM shareholder known by our management to be
the owner of 5% or more of YUM common stock. This information is presented as of December 31, 2008,
and is based on stock ownership reports on Schedule 13G filed by each of these shareholders with the SEC
and provided to us.
Number of Shares Percent of
Name and Address of Beneficial Owner Beneficially Owned Class
Southeastern Asset Management, Inc ............................ 31,824,166(1) 6.9%
6410 Poplar Avenue, Suite 900
Memphis, Tennessee 38119
Marsico Capital Management, LLC ............................. 23,906,626(2) 5.2%
1200 17th Street, Suite 1600
Denver, Colorado 80202
State Street Bank and Trust Company ........................... 23,245,601(3) 5.0%
State Street Financial Center
One Lincoln Street
Boston, MA 02111
(1) The filing indicates sole voting power for 13,217,786 shares, shared voting power for 16,280,056
shares, no voting power for 2,326,324 shares, sole dispositive power for 15,518,110 shares, shared
dispositive power for 16,280,056 shares and no dispositive power for 26,000 shares.
(2) The filing indicates sole voting power for 19,924,162 shares, shared voting power for no shares, sole
dispositive power for 23,906,626 shares, and shared dispositive power for no shares.
(3) The filing indicates sole voting power for 17,914,953 shares, shared voting power for no shares, sole
dispositive power for no shares and shared dispositive power for 23,245,601 shares.
Proxy Statement
How much YUM common stock is owned by our directors, director nominees and executive officers?
This table shows the beneficial ownership of YUM common stock as of December 31, 2008 by
• each of our nominees for election as directors,
• each of the executive officers named in the Summary Compensation Table on page 59, and
• all directors, director nominees and executive officers as a group.
Unless we note otherwise, each of the following persons and their family members has sole voting and
investment power with respect to the shares of common stock beneficially owned by him or her. None of
the persons in this table hold in excess of one percent of the outstanding YUM common stock, except for
Mr. Novak who beneficially owns approximately 1.4% Directors, director nominees and executive officers
as a group beneficially own approximately 3.0%. Our internal stock ownership guidelines call for the
Chairman to own 336,000 shares of YUM common stock or stock equivalents. Guidelines for our other
named executive officers call for them to own 50,000 shares of YUM common stock or stock equivalents
within five years following their appointment to their current position. Other executive officers are
required to own 24,000 shares or share equivalents.
The table shows the number of shares of common stock and common stock equivalents beneficially
owned as of December 31, 2008. Included are shares that could have been acquired within 60 days of
December 31, 2008 through the exercise of stock options, stock appreciation rights or distributions from
36