Pizza Hut 2008 Annual Report Download - page 209
Download and view the complete annual report
Please find page 209 of the 2008 Pizza Hut annual report below. You can navigate through the pages in the report by either clicking on the pages listed below, or by using the keyword search tool below to find specific information within the annual report.-
 1
1 -
2
-
3
-
4
-
5
-
6
-
7
-
8
-
9
-
10
-
11
-
12
-
13
-
14
-
15
-
16
-
17
-
18
-
19
-
20
-
21
-
22
-
23
-
24
-
25
-
26
-
27
-
28
-
29
-
30
-
31
-
32
-
33
-
34
-
35
-
36
-
37
-
38
-
39
-
40
-
41
-
42
-
43
-
44
-
45
-
46
-
47
-
48
-
49
-
50
-
51
-
52
-
53
-
54
-
55
-
56
-
57
-
58
-
59
-
60
-
61
-
62
-
63
-
64
-
65
-
66
-
67
-
68
-
69
-
70
-
71
-
72
-
73
-
74
-
75
-
76
-
77
-
78
-
79
-
80
-
81
-
82
-
83
-
84
-
85
-
86
-
87
-
88
-
89
-
90
-
91
-
92
-
93
-
94
-
95
-
96
-
97
-
98
-
99
-
100
-
101
-
102
-
103
-
104
-
105
-
106
-
107
-
108
-
109
-
110
-
111
-
112
-
113
-
114
-
115
-
116
-
117
-
118
-
119
-
120
-
121
-
122
-
123
-
124
-
125
-
126
-
127
-
128
-
129
-
130
-
131
-
132
-
133
-
134
-
135
-
136
-
137
-
138
-
139
-
140
-
141
-
142
-
143
-
144
-
145
-
146
-
147
-
148
-
149
-
150
-
151
-
152
-
153
-
154
-
155
-
156
-
157
-
158
-
159
-
160
-
161
-
162
-
163
-
164
-
165
-
166
-
167
-
168
-
169
-
170
-
171
-
172
-
173
-
174
-
175
-
176
-
177
-
178
-
179
-
180
-
181
-
182
-
183
-
184
-
185
-
186
-
187
-
188
-
189
-
190
-
191
-
192
-
193
-
194
-
195
-
196
-
197
-
198
-
 199
199 -
 200
200 -
 201
201 -
 202
202 -
 203
203 -
 204
204 -
 205
205 -
 206
206 -
 207
207 -
 208
208 -
 209
209 -
 210
210 -
 211
211 -
 212
212 -
 213
213 -
 214
214 -
 215
215 -
 216
216 -
 217
217 -
 218
218 -
 219
219 -
220
-
221
-
222
-
223
-
224
-
225
-
226
-
227
-
228
-
229
-
230
-
231
-
232
-
233
-
234
-
235
-
236
-
237
-
238
-
239
-
240
 |
 |

87
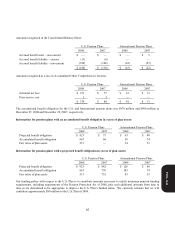
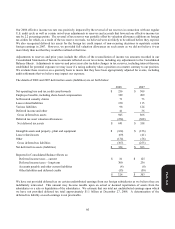
The estimated net loss for the U.S. and International pension plans that will be amortized from accumulated other
comprehensive loss into net periodic pension cost in 2009 is $13 million and $2 million, respectively. The estimated prior
service cost for the U.S. pension plans that will be amortized from accumulated other comprehensive loss into net periodic
pension cost in 2009 is $1 million.
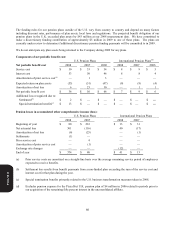
Weighted-average assumptions used to determine benefit obligations at the measurement dates:
U.S. Pension Plans International Pension Plans
2008 2007 2008 2007
Discount rate 6.50% 6.50% 5.50% 5.60%
Rate of compensation increase 3.75% 3.75% 4.10% 4.30%
Weighted-average assumptions used to determine the net periodic benefit cost for fiscal years:
U.S. Pension Plans International Pension Plans
2008 2007 2006 2008 2007 2006
Discount rate 6.50% 5.95% 5.75% 5.60% 5.00% 5.00%
Long-term rate of return on plan
assets 8.00% 8.00% 8.00% 7.28% 7.07% 6.70%
Rate of compensation increase 3.75% 3.75% 3.75% 4.30% 3.78% 3.85%
Our estimated long-term rate of return on plan assets represents the weighted-average of expected future returns on the
asset categories included in our target investment allocation based primarily on the historical returns for each asset
category, adjusted for an assessment of current market conditions.
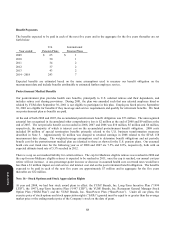
Plan Assets
Our pension plan weighted-average asset allocations at the measurement dates, by asset category are set forth below:
U.S. Pension Plans International Pension Plans
Asset Category 2008 2007 2008 2007
Equity securities 59% 71% 73% 80%
Debt securities 41 29 27 20
Total 100% 100% 100% 100%
Our primary objectives regarding the Plan’s assets, which make up 86% of total pension plan assets at the 2008
measurement dates, are to optimize return on assets subject to acceptable risk and to maintain liquidity, meet minimum
funding requirements and minimize plan expenses. To achieve these objectives, we have adopted a passive investment
strategy in which the asset performance is driven primarily by the investment allocation. Our target investment allocation
is 65% equity securities and 35% debt securities, consisting primarily of low cost index mutual funds that track several
sub-categories of equity and debt security performance. The investment strategy is primarily driven by our Plan’s
participants’ ages and reflects a long-term investment horizon favoring a higher equity component in the investment
allocation.
A mutual fund held as an investment by the Plan includes YUM stock valued at less than $0.5 million at December 27,
2008 and September 30, 2007 (less than 1% of total plan assets in each instance).
Form 10-K