Pizza Hut 2008 Annual Report Download - page 157
Download and view the complete annual report
Please find page 157 of the 2008 Pizza Hut annual report below. You can navigate through the pages in the report by either clicking on the pages listed below, or by using the keyword search tool below to find specific information within the annual report.-
 1
1 -
2
-
3
-
4
-
5
-
6
-
7
-
8
-
9
-
10
-
11
-
12
-
13
-
14
-
15
-
16
-
17
-
18
-
19
-
20
-
21
-
22
-
23
-
24
-
25
-
26
-
27
-
28
-
29
-
30
-
31
-
32
-
33
-
34
-
35
-
36
-
37
-
38
-
39
-
40
-
41
-
42
-
43
-
44
-
45
-
46
-
47
-
48
-
49
-
50
-
51
-
52
-
53
-
54
-
55
-
56
-
57
-
58
-
59
-
60
-
61
-
62
-
63
-
64
-
65
-
66
-
67
-
68
-
69
-
70
-
71
-
72
-
73
-
74
-
75
-
76
-
77
-
78
-
79
-
80
-
81
-
82
-
83
-
84
-
85
-
86
-
87
-
88
-
89
-
90
-
91
-
92
-
93
-
94
-
95
-
96
-
97
-
98
-
99
-
100
-
101
-
102
-
103
-
104
-
105
-
106
-
107
-
108
-
109
-
110
-
111
-
112
-
113
-
114
-
115
-
116
-
117
-
118
-
119
-
120
-
121
-
122
-
123
-
124
-
125
-
126
-
127
-
128
-
129
-
130
-
131
-
132
-
133
-
134
-
135
-
136
-
137
-
138
-
139
-
140
-
141
-
142
-
143
-
144
-
145
-
146
-
 147
147 -
 148
148 -
 149
149 -
 150
150 -
 151
151 -
 152
152 -
 153
153 -
 154
154 -
 155
155 -
 156
156 -
 157
157 -
 158
158 -
 159
159 -
 160
160 -
 161
161 -
 162
162 -
 163
163 -
 164
164 -
 165
165 -
 166
166 -
 167
167 -
168
-
169
-
170
-
171
-
172
-
173
-
174
-
175
-
176
-
177
-
178
-
179
-
180
-
181
-
182
-
183
-
184
-
185
-
186
-
187
-
188
-
189
-
190
-
191
-
192
-
193
-
194
-
195
-
196
-
197
-
198
-
199
-
200
-
201
-
202
-
203
-
204
-
205
-
206
-
207
-
208
-
209
-
210
-
211
-
212
-
213
-
214
-
215
-
216
-
217
-
218
-
219
-
220
-
221
-
222
-
223
-
224
-
225
-
226
-
227
-
228
-
229
-
230
-
231
-
232
-
233
-
234
-
235
-
236
-
237
-
238
-
239
-
240
 |
 |

35
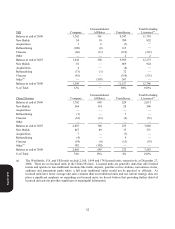
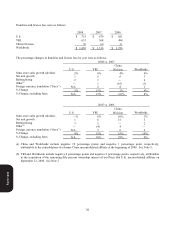
Revenues
Company sales were as follows:
2008 2007 2006
U.S. $ 4,410 $ 4,518 $ 4,952
YRI 2,375 2,507 1,826
China Division 3
,
058 2
,
075 1
,
587
Worldwide
$
9
,
843
$
9
,
100
$
8
,
365
The following tables detail the key drivers of the year-over-year changes of Company sales and Franchise and license
fees. Same store sales growth is the estimated growth in sales of all restaurants that have been open one year or more.
Net unit growth represents the net impact of actual sales or fee additions due to new unit openings and historical sales or
fee reductions due to closures. Refranchising represents the amount of Company sales for the periods in the prior year
while the Company operated the restaurants but did not operate them in the current year or the impact on Franchise and
license fees for amounts from refranchised restaurants that were recorded by the Company in the current year during
periods in which the restaurants were Company stores in the prior year. Other represents the impact of acquisitions,
unusual or significant items and roundings, which are footnoted as necessary.
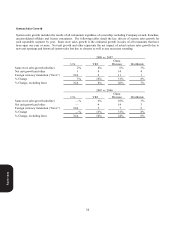
The percentage changes in company sales by year were as follows:
2008 vs. 2007
U.S. YRI
China
Division Worldwide
Same store sales
g
rowth
(
decline
)
3
%
—
%
7
%
3
%
Net unit growth 1 1 16 4
Refranchising
(
7
)
(
4
)
—
(
5
)
Other(a) 1
—
13 4
Foreign currency translation (“forex”) N/A
(
2
)
11 2
% Chan
g
e
(
2
)
%
(
5
)
%
47
%
8
%
% Change, excluding forex N/A
(
3
)
% 36% 6%
2007 vs. 2006
U.S. YRI
China
Division Worldwide
Same store sales
g
rowth
(
decline
)
(
3
)
%
5
%
10
%
2
%
Net unit growth 1 2 15 4
Refranchising
(
8
)
(
8
)
—
(
6
)
Other(b) 132
(
1
)
6
Foreign currency translation (“forex”) N/A 67 3
% Chan
g
e
(
9
)
%
37
%
31
%
9
%
% Change, excluding forex N/A 31% 24% 6%
(a) China and Worldwide include 13 percentage points and 3 percentage points, respectively, attributable to the
consolidation of a former China unconsolidated affiliate at the beginning of 2008. See Note 5.
(b) YRI and Worldwide include 32 percentage points and 7 percentage points, respectively, attributable to the acquisition
of the remaining fifty percent ownership interest of our Pizza Hut U.K. unconsolidated affiliate on September 12,
2006. See Note 5.
Form 10-K