Pizza Hut 2008 Annual Report Download - page 178
Download and view the complete annual report
Please find page 178 of the 2008 Pizza Hut annual report below. You can navigate through the pages in the report by either clicking on the pages listed below, or by using the keyword search tool below to find specific information within the annual report.-
 1
1 -
2
-
3
-
4
-
5
-
6
-
7
-
8
-
9
-
10
-
11
-
12
-
13
-
14
-
15
-
16
-
17
-
18
-
19
-
20
-
21
-
22
-
23
-
24
-
25
-
26
-
27
-
28
-
29
-
30
-
31
-
32
-
33
-
34
-
35
-
36
-
37
-
38
-
39
-
40
-
41
-
42
-
43
-
44
-
45
-
46
-
47
-
48
-
49
-
50
-
51
-
52
-
53
-
54
-
55
-
56
-
57
-
58
-
59
-
60
-
61
-
62
-
63
-
64
-
65
-
66
-
67
-
68
-
69
-
70
-
71
-
72
-
73
-
74
-
75
-
76
-
77
-
78
-
79
-
80
-
81
-
82
-
83
-
84
-
85
-
86
-
87
-
88
-
89
-
90
-
91
-
92
-
93
-
94
-
95
-
96
-
97
-
98
-
99
-
100
-
101
-
102
-
103
-
104
-
105
-
106
-
107
-
108
-
109
-
110
-
111
-
112
-
113
-
114
-
115
-
116
-
117
-
118
-
119
-
120
-
121
-
122
-
123
-
124
-
125
-
126
-
127
-
128
-
129
-
130
-
131
-
132
-
133
-
134
-
135
-
136
-
137
-
138
-
139
-
140
-
141
-
142
-
143
-
144
-
145
-
146
-
147
-
148
-
149
-
150
-
151
-
152
-
153
-
154
-
155
-
156
-
157
-
158
-
159
-
160
-
161
-
162
-
163
-
164
-
165
-
166
-
167
-
 168
168 -
 169
169 -
 170
170 -
 171
171 -
 172
172 -
 173
173 -
 174
174 -
 175
175 -
 176
176 -
 177
177 -
 178
178 -
 179
179 -
 180
180 -
 181
181 -
 182
182 -
 183
183 -
 184
184 -
 185
185 -
 186
186 -
 187
187 -
 188
188 -
189
-
190
-
191
-
192
-
193
-
194
-
195
-
196
-
197
-
198
-
199
-
200
-
201
-
202
-
203
-
204
-
205
-
206
-
207
-
208
-
209
-
210
-
211
-
212
-
213
-
214
-
215
-
216
-
217
-
218
-
219
-
220
-
221
-
222
-
223
-
224
-
225
-
226
-
227
-
228
-
229
-
230
-
231
-
232
-
233
-
234
-
235
-
236
-
237
-
238
-
239
-
240
 |
 |

56
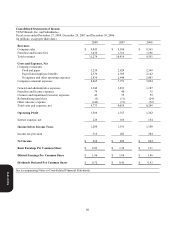
Consolidated Statements of Income
YUM! Brands, Inc. and Subsidiaries
Fiscal years ended December 27, 2008, December 29, 2007 and December 30, 2006
(in millions, except per share data)
2008 2007 2006
Revenues
Company sales $ 9,843 $ 9,100 $ 8,365
Franchise and license fees 1,436 1,316 1,196
Total revenues 11,279 10,416 9,561
Costs and Expenses, Net
Company restaurants
Food and paper 3,239 2,824 2,549
Payroll and employee benefits 2,370 2,305 2,142
Occupancy and other operating expenses 2,856 2,644 2,403
Company restaurant expenses 8,465 7,773 7,094
General and administrative expenses 1,342 1,293 1,187
Franchise and license expenses 74 40 35
Closures and impairment (income) expenses 43 35 59
Refranchising (gain) loss (5) (11) (24)
Other (income) expense (146) (71) (52)
Total costs and expenses, net 9,773 9,059 8,299
Operating Profit 1,506 1,357 1,262
Interest expense, net 226 166 154
Income before Income Taxes 1,280 1,191 1,108
Income tax provision 316 282 284
Net Income $ 964 $ 909 $ 824
Basic Earnings Per Common Share $ 2.03 $ 1.74 $ 1.51
Diluted Earnings Per Common Share $ 1.96 $ 1.68 $ 1.46
Dividends Declared Per Common Share $ 0.72 $ 0.45 $ 0.43
See accompanying Notes to Consolidated Financial Statements.
Form 10-K