Pizza Hut 2008 Annual Report Download - page 67
Download and view the complete annual report
Please find page 67 of the 2008 Pizza Hut annual report below. You can navigate through the pages in the report by either clicking on the pages listed below, or by using the keyword search tool below to find specific information within the annual report.-
 1
1 -
2
-
3
-
4
-
5
-
6
-
7
-
8
-
9
-
10
-
11
-
12
-
13
-
14
-
15
-
16
-
17
-
18
-
19
-
20
-
21
-
22
-
23
-
24
-
25
-
26
-
27
-
28
-
29
-
30
-
31
-
32
-
33
-
34
-
35
-
36
-
37
-
38
-
39
-
40
-
41
-
42
-
43
-
44
-
45
-
46
-
47
-
48
-
49
-
50
-
51
-
52
-
53
-
54
-
55
-
56
-
 57
57 -
 58
58 -
 59
59 -
 60
60 -
 61
61 -
 62
62 -
 63
63 -
 64
64 -
 65
65 -
 66
66 -
 67
67 -
 68
68 -
 69
69 -
 70
70 -
 71
71 -
 72
72 -
 73
73 -
 74
74 -
 75
75 -
 76
76 -
 77
77 -
78
-
79
-
80
-
81
-
82
-
83
-
84
-
85
-
86
-
87
-
88
-
89
-
90
-
91
-
92
-
93
-
94
-
95
-
96
-
97
-
98
-
99
-
100
-
101
-
102
-
103
-
104
-
105
-
106
-
107
-
108
-
109
-
110
-
111
-
112
-
113
-
114
-
115
-
116
-
117
-
118
-
119
-
120
-
121
-
122
-
123
-
124
-
125
-
126
-
127
-
128
-
129
-
130
-
131
-
132
-
133
-
134
-
135
-
136
-
137
-
138
-
139
-
140
-
141
-
142
-
143
-
144
-
145
-
146
-
147
-
148
-
149
-
150
-
151
-
152
-
153
-
154
-
155
-
156
-
157
-
158
-
159
-
160
-
161
-
162
-
163
-
164
-
165
-
166
-
167
-
168
-
169
-
170
-
171
-
172
-
173
-
174
-
175
-
176
-
177
-
178
-
179
-
180
-
181
-
182
-
183
-
184
-
185
-
186
-
187
-
188
-
189
-
190
-
191
-
192
-
193
-
194
-
195
-
196
-
197
-
198
-
199
-
200
-
201
-
202
-
203
-
204
-
205
-
206
-
207
-
208
-
209
-
210
-
211
-
212
-
213
-
214
-
215
-
216
-
217
-
218
-
219
-
220
-
221
-
222
-
223
-
224
-
225
-
226
-
227
-
228
-
229
-
230
-
231
-
232
-
233
-
234
-
235
-
236
-
237
-
238
-
239
-
240
 |
 |

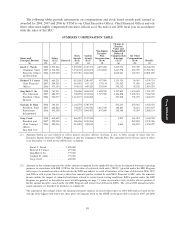
23MAR200920295069
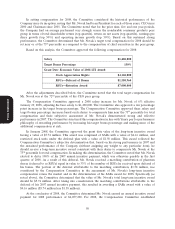
Based on this assessment for 2008, Messrs. Carucci and Creed received a stock appreciation rights
grant and Mr. Su received a stock option grant at the 50th percentile of the survey data. Mr. Allan received
a stock appreciation rights grant above the 50th percentile of the survey data. Each SAR and Stock Option
was granted at the closing market price of the underlying YUM common stock on the date of grant. As
with other elements of compensation, the Committee does not measure or review the percentile ranking of
actual long-term incentive compensation.
Mr. Novak’s long-term incentive compensation is discussed on page 50.
From time to time and in addition to the regular annual grant, Chairman’s Award stock option or
SAR grants are made to selected employees in recognition of superlative performance and extraordinary
impact on business results. In the case of employees below the Senior Leadership Team Level, these
awards are made at the discretion of the CEO. Awards to executives on the Senior Leadership Team must
be approved by the Compensation Committee. These SARs or stock options may vest in their entirety after
four or five years or 25% per year over four years. In 2008, in addition to their regular grants, Mr. Su
received a Chairman’s Award grant of stock options with a fair value of $2.9 million and Mr. Carucci
received a Chairman’s Award grant of stock appreciation rights with a fair value of $1.5 million. Mr. Su’s
award was based on the Committee’s subjective assessment of the continued strong performance of the
China Division in 2007 and his position as a senior leader in the Company. Mr. Carucci’s award was based
on the consistently superior financial performance of the Company in the areas of total shareholder return,
return on net assets, EPS growth and operating income growth under his leadership.
How we Compensate our Chief Executive Officer
Comparative Compensation Data—Mr. Novak
In reviewing and setting 2008 compensation for Mr. Novak, the Committee used data from Hewitt
Associates for a select group of nondurable consumer products companies as this group represented the
best market reference point, noting that the median annual revenues for the group was $15.2 billion
compared to the Company revenues of $15.2 billion (as adjusted to consider franchisee sales as described
on page 43). Hewitt Associates provided a comprehensive review for the Compensation Committee using
data from this peer group. The companies comprising this nondurable consumer products group are:
Proxy Statement
Albertsons Inc. Darden Restaurants, Inc. Lowe’s Companies, Inc.
Anheuser-Busch Companies, Inc. Dollar General Corporation Marriott International, Inc.
AutoNation, Inc. Federated Department Mars, Incorporated
AutoZone, Inc. The Gap, Inc. McDonald’s Corporation
Avon Products, Inc. General Mills, Inc. Meijer, Inc.
Blockbuster Inc. J.C. Penney Company, Inc. Office Depot
CDW Corporation Kellogg Company OfficeMax Incorporated
The Coca-Cola Company Kimberly-Clark Corporation PepsiCo, Inc.
Colgate-Palmolive Company Kohl’s Corporation Staples, Inc.
CVS Corporation Limited Brands Walgreen Co.
Mr. Novak’s Compensation
Each year, our Board, under the leadership of the Compensation Committee Chairperson, conducts
an evaluation of the performance of our CEO, David Novak. This evaluation includes a review of his:
• leadership pertaining to business execution and the achievement of business results
• leadership in the development and implementation of Company strategies
• development of diversity and management talent
49