Pizza Hut 2008 Annual Report Download - page 216
Download and view the complete annual report
Please find page 216 of the 2008 Pizza Hut annual report below. You can navigate through the pages in the report by either clicking on the pages listed below, or by using the keyword search tool below to find specific information within the annual report.-
 1
1 -
2
-
3
-
4
-
5
-
6
-
7
-
8
-
9
-
10
-
11
-
12
-
13
-
14
-
15
-
16
-
17
-
18
-
19
-
20
-
21
-
22
-
23
-
24
-
25
-
26
-
27
-
28
-
29
-
30
-
31
-
32
-
33
-
34
-
35
-
36
-
37
-
38
-
39
-
40
-
41
-
42
-
43
-
44
-
45
-
46
-
47
-
48
-
49
-
50
-
51
-
52
-
53
-
54
-
55
-
56
-
57
-
58
-
59
-
60
-
61
-
62
-
63
-
64
-
65
-
66
-
67
-
68
-
69
-
70
-
71
-
72
-
73
-
74
-
75
-
76
-
77
-
78
-
79
-
80
-
81
-
82
-
83
-
84
-
85
-
86
-
87
-
88
-
89
-
90
-
91
-
92
-
93
-
94
-
95
-
96
-
97
-
98
-
99
-
100
-
101
-
102
-
103
-
104
-
105
-
106
-
107
-
108
-
109
-
110
-
111
-
112
-
113
-
114
-
115
-
116
-
117
-
118
-
119
-
120
-
121
-
122
-
123
-
124
-
125
-
126
-
127
-
128
-
129
-
130
-
131
-
132
-
133
-
134
-
135
-
136
-
137
-
138
-
139
-
140
-
141
-
142
-
143
-
144
-
145
-
146
-
147
-
148
-
149
-
150
-
151
-
152
-
153
-
154
-
155
-
156
-
157
-
158
-
159
-
160
-
161
-
162
-
163
-
164
-
165
-
166
-
167
-
168
-
169
-
170
-
171
-
172
-
173
-
174
-
175
-
176
-
177
-
178
-
179
-
180
-
181
-
182
-
183
-
184
-
185
-
186
-
187
-
188
-
189
-
190
-
191
-
192
-
193
-
194
-
195
-
196
-
197
-
198
-
199
-
200
-
201
-
202
-
203
-
204
-
205
-
 206
206 -
 207
207 -
 208
208 -
 209
209 -
 210
210 -
 211
211 -
 212
212 -
 213
213 -
 214
214 -
 215
215 -
 216
216 -
 217
217 -
 218
218 -
 219
219 -
 220
220 -
 221
221 -
 222
222 -
 223
223 -
 224
224 -
 225
225 -
 226
226 -
227
-
228
-
229
-
230
-
231
-
232
-
233
-
234
-
235
-
236
-
237
-
238
-
239
-
240
 |
 |

94
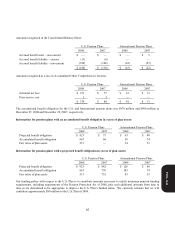
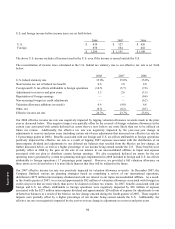
U.S. and foreign income before income taxes are set forth below:
2008 2007 2006
U.S. $ 430 $ 527 $ 626
Forei
g
n 850 664 482
$1
,
280 $ 1
,
191 $1
,
108
The above U.S. income includes all income taxed in the U.S. even if the income is earned outside the U.S.
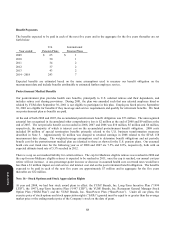
The reconciliation of income taxes calculated at the U.S. federal tax statutory rate to our effective tax rate is set forth
below:
2008 2007 2006
U.S. federal statutory rate 35.0% 35.0% 35.0%
State income tax, net of federal tax benefit 0.6 1.0 2.0
Foreign and U.S. tax effects attributable to foreign operations (14.5) (5.7) (7.8)
Adjustments to reserves and prior years 3.5 2.6 (3.5)
Repatriation of foreign earnings
—
—
(0.4)
Non-recurring foreign tax credit adjustments
—
—
(6.2)
Valuation allowance additions (reversals) 0.6 (9.0) 6.8
Other, net (0.5) (0.2) (0.3)
Effective income tax rate 24.7% 23.7% 25.6%
Our 2008 effective income tax rate was negatively impacted by lapping valuation allowance reversals made in the prior
year as discussed below. This negative impact was partially offset by the reversal of foreign valuation allowances in the
current year associated with certain deferred tax assets that we now believe are more likely than not to be utilized on
future tax returns. Additionally, the effective tax rate was negatively impacted by the year-over-year change in
adjustments to reserves and prior years (including certain out-of-year adjustments that increased our effective tax rate by
1.8 percentage points in 2008). Benefits associated with our foreign and U.S. tax effects attributable to foreign operations
positively impacted the effective tax rate as a result of lapping 2007 expenses associated with the distribution of an
intercompany dividend and adjustments to our deferred tax balances that resulted from the Mexico tax law change, as
further discussed below, as well as a higher percentage of our income being earned outside the U.S. These benefits were
partially offset in 2008 by the gain on the sale of our interest in our unconsolidated affiliate in Japan and expense
associated with our plan to distribute certain foreign earnings. We also recognized deferred tax assets for the net
operating losses generated by certain tax planning strategies implemented in 2008 included in foreign and U.S. tax effects
attributable to foreign operations (1.7 percentage point impact). However, we provided a full valuation allowance on
these assets as we do not believe it is more likely than not that they will be realized in the future.
Our 2007 effective income tax rate was positively impacted by valuation allowance reversals. In December 2007, the
Company finalized various tax planning strategies based on completing a review of our international operations,
distributed a $275 million intercompany dividend and sold our interest in our Japan unconsolidated affiliate. As a result,
in the fourth quarter of 2007, we reversed approximately $82 million of valuation allowances associated with foreign tax
credit carryovers that are more likely than not to be claimed on future tax returns. In 2007, benefits associated with our
foreign and U.S. tax effects attributable to foreign operations were negatively impacted by $36 million of expense
associated with the $275 million intercompany dividend and approximately $20 million of expense for adjustments to our
deferred tax balances as a result of the Mexico tax law change enacted during the fourth quarter of 2007. These negative
impacts were partially offset by a higher percentage of our income being earned outside the U.S. Additionally, the
effective tax rate was negatively impacted by the year-over-year change in adjustments to reserves and prior years.
Form 10-K