Pizza Hut 2008 Annual Report Download - page 162
Download and view the complete annual report
Please find page 162 of the 2008 Pizza Hut annual report below. You can navigate through the pages in the report by either clicking on the pages listed below, or by using the keyword search tool below to find specific information within the annual report.-
 1
1 -
2
-
3
-
4
-
5
-
6
-
7
-
8
-
9
-
10
-
11
-
12
-
13
-
14
-
15
-
16
-
17
-
18
-
19
-
20
-
21
-
22
-
23
-
24
-
25
-
26
-
27
-
28
-
29
-
30
-
31
-
32
-
33
-
34
-
35
-
36
-
37
-
38
-
39
-
40
-
41
-
42
-
43
-
44
-
45
-
46
-
47
-
48
-
49
-
50
-
51
-
52
-
53
-
54
-
55
-
56
-
57
-
58
-
59
-
60
-
61
-
62
-
63
-
64
-
65
-
66
-
67
-
68
-
69
-
70
-
71
-
72
-
73
-
74
-
75
-
76
-
77
-
78
-
79
-
80
-
81
-
82
-
83
-
84
-
85
-
86
-
87
-
88
-
89
-
90
-
91
-
92
-
93
-
94
-
95
-
96
-
97
-
98
-
99
-
100
-
101
-
102
-
103
-
104
-
105
-
106
-
107
-
108
-
109
-
110
-
111
-
112
-
113
-
114
-
115
-
116
-
117
-
118
-
119
-
120
-
121
-
122
-
123
-
124
-
125
-
126
-
127
-
128
-
129
-
130
-
131
-
132
-
133
-
134
-
135
-
136
-
137
-
138
-
139
-
140
-
141
-
142
-
143
-
144
-
145
-
146
-
147
-
148
-
149
-
150
-
151
-
 152
152 -
 153
153 -
 154
154 -
 155
155 -
 156
156 -
 157
157 -
 158
158 -
 159
159 -
 160
160 -
 161
161 -
 162
162 -
 163
163 -
 164
164 -
 165
165 -
 166
166 -
 167
167 -
 168
168 -
 169
169 -
 170
170 -
 171
171 -
 172
172 -
173
-
174
-
175
-
176
-
177
-
178
-
179
-
180
-
181
-
182
-
183
-
184
-
185
-
186
-
187
-
188
-
189
-
190
-
191
-
192
-
193
-
194
-
195
-
196
-
197
-
198
-
199
-
200
-
201
-
202
-
203
-
204
-
205
-
206
-
207
-
208
-
209
-
210
-
211
-
212
-
213
-
214
-
215
-
216
-
217
-
218
-
219
-
220
-
221
-
222
-
223
-
224
-
225
-
226
-
227
-
228
-
229
-
230
-
231
-
232
-
233
-
234
-
235
-
236
-
237
-
238
-
239
-
240
 |
 |

40
YRI Operating Profit increased 18% in 2007 including a 6% favorable impact from foreign currency translation. The
increase was driven by the impact of same store sales growth and new unit development on restaurant profit and franchise
and license fees. The increase was partially offset by higher G&A expenses (including expenses which were previously
netted within equity income prior to our acquisition of the remaining fifty percent of the Pizza Hut U.K. business) and
higher restaurant operating costs.
China Division Operating Profit increased 25% and 30% in 2008 and 2007, respectively, including an 11% and 7%
favorable impact from foreign currency translation, respectively. The increases were driven by the impact of same store
sales growth and net unit development on restaurant profit. The increases were partially offset by higher restaurant
operating costs and higher G&A expenses.
Unallocated and corporate expenses increased 19% in 2008 due to U.S. G&A productivity initiatives and realignment of
resources and investments in the U.S. Brands, as discussed in the Significant Gains and Charges section of this MD&A,
partially offset by lower annual incentive compensation expenses. The 12% increase in unallocated and corporate
expenses in 2007 was driven by an increase in annual incentive compensation and project costs.
Unallocated Other income (expense) in 2008 includes a $100 million gain recognized on the sale of our interest in our
unconsolidated affiliate in Japan. See Note 5.
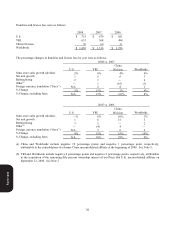
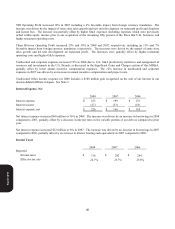
Interest Expense, Net
2008 2007 2006
Interest expense $ 253 $ 199 $ 172
Interest income (27)
(33)
(18)
Interest expense, net $ 226 $ 166 $ 154
Net interest expense increased $60 million or 36% in 2008. The increase was driven by an increase in borrowings in 2008
compared to 2007, partially offset by a decrease in interest rates in the variable portion of our debt as compared to prior
year.
Net interest expense increased $12 million or 8% in 2007. The increase was driven by an increase in borrowings in 2007
compared to 2006, partially offset by an increase in interest bearing cash equivalents in 2007 compared to 2006.
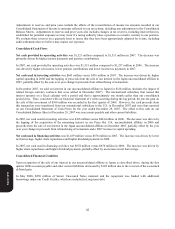
Income Taxes
2008 2007 2006
Reported
Income taxes $ 316 $ 282 $ 284
Effective tax rate 24.7% 23.7% 25.6%
Form 10-K