Pizza Hut 2008 Annual Report Download - page 147
Download and view the complete annual report
Please find page 147 of the 2008 Pizza Hut annual report below. You can navigate through the pages in the report by either clicking on the pages listed below, or by using the keyword search tool below to find specific information within the annual report.
25
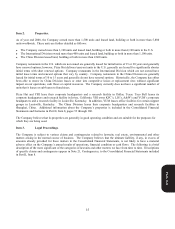
Strategies
The Company continues to focus on four key strategies:
Build Leading Brands in China in Every Significant Category – The Company has developed the KFC and Pizza Hut
brands into the leading quick service and casual dining restaurants, respectively, in mainland China. Additionally, the
Company owns and operates the distribution system for its restaurants in mainland China which we believe provides a
significant competitive advantage. Given this strong competitive position, a rapidly growing economy and a population
of 1.3 billion in mainland China, the Company is rapidly adding KFC and Pizza Hut Casual Dining restaurants and testing
the additional restaurant concepts of Pizza Hut Home Service (pizza delivery) and East Dawning (Chinese food). Our
ongoing earnings growth model includes annual system-sales growth of 20% in mainland China driven by new unit
development each year, which we expect to drive annual operating profit growth of 20% in the China Division.
Drive Aggressive International Expansion and Build Strong Brands Everywhere – The Company and its franchisees
opened over 900 new restaurants in 2008 in the Company’s International Division, representing 9 straight years of
opening over 700 restaurants. The International Division generated $528 million in Operating Profit in 2008 up from
$186 million in 1998. The Company expects to continue to experience strong growth by building out existing markets
and growing in new markets including India, France and Russia. Our ongoing earnings growth model includes annual
operating profit growth of 10% driven by new unit development and same store sales growth for the International
Division. New unit development is expected to contribute to system sales growth of at least 6% each year.
Dramatically Improve U.S. Brand Positions, Consistency and Returns – The Company continues to focus on improving its
U.S. position through differentiated products and marketing and an improved customer experience. The Company also
strives to provide industry leading new product innovation which adds sales layers and expands day parts. We are the
leader in multibranding, with more than 4,600 restaurants providing customers two or more of our brands at a single
location. We continue to evaluate our returns and ownership positions with an earn the right to own philosophy on
Company owned restaurants. Our ongoing earnings growth model calls for annual operating profit growth of 5% in the
U.S. with same store sales growth of 2% to 3% and leverage of our General and Administrative (“G&A”) infrastructure.
Drive Industry-Leading, Long-Term Shareholder and Franchisee Value – The Company is focused on delivering high
returns and returning substantial cash flows to its shareholders via share repurchases and dividends. The Company has
one of the highest returns on invested capital in the Quick Service Restaurants (“QSR”) industry. Additionally, 2008 was
the fourth consecutive year in which the Company returned over $1.1 billion to its shareholders through share repurchases
and dividends. The Company is targeting an annual dividend payout ratio of 35% to 40% of net income.
Details of our 2009 Guidance by division can be found online at http://www.yum.com/investors/news.asp and
http://investors.yum.com/phoenix.zhtml?c=117941&p=irol-newsEarnings. The fourth quarter earnings release included
preliminary and unaudited Consolidated Statements of Cash Flows and Consolidated Balance Sheets, which have been
updated in this Form 10-K.
2008 Highlights
•Worldwide system sales growth of 7%, excluding foreign currency translation
• Worldwide same store sales growth of 3%
• Record international development of 1,495 new units
• Worldwide Operating Profit growth of 11%, including a 3%, or $39 million, positive impact as described in the
Significant Gains and Charges section of this MD&A
• Operating Profit growth of 25% in the China Division and 10% in the YRI Division, partially offset by a 6% decline
in the U.S.
• Record shareholder payout of nearly $2 billion through share buybacks and dividends, with share buybacks reducing
average diluted share counts by 9%
Form 10-K


