Pizza Hut 2008 Annual Report Download - page 156
Download and view the complete annual report
Please find page 156 of the 2008 Pizza Hut annual report below. You can navigate through the pages in the report by either clicking on the pages listed below, or by using the keyword search tool below to find specific information within the annual report.-
 1
1 -
2
-
3
-
4
-
5
-
6
-
7
-
8
-
9
-
10
-
11
-
12
-
13
-
14
-
15
-
16
-
17
-
18
-
19
-
20
-
21
-
22
-
23
-
24
-
25
-
26
-
27
-
28
-
29
-
30
-
31
-
32
-
33
-
34
-
35
-
36
-
37
-
38
-
39
-
40
-
41
-
42
-
43
-
44
-
45
-
46
-
47
-
48
-
49
-
50
-
51
-
52
-
53
-
54
-
55
-
56
-
57
-
58
-
59
-
60
-
61
-
62
-
63
-
64
-
65
-
66
-
67
-
68
-
69
-
70
-
71
-
72
-
73
-
74
-
75
-
76
-
77
-
78
-
79
-
80
-
81
-
82
-
83
-
84
-
85
-
86
-
87
-
88
-
89
-
90
-
91
-
92
-
93
-
94
-
95
-
96
-
97
-
98
-
99
-
100
-
101
-
102
-
103
-
104
-
105
-
106
-
107
-
108
-
109
-
110
-
111
-
112
-
113
-
114
-
115
-
116
-
117
-
118
-
119
-
120
-
121
-
122
-
123
-
124
-
125
-
126
-
127
-
128
-
129
-
130
-
131
-
132
-
133
-
134
-
135
-
136
-
137
-
138
-
139
-
140
-
141
-
142
-
143
-
144
-
145
-
 146
146 -
 147
147 -
 148
148 -
 149
149 -
 150
150 -
 151
151 -
 152
152 -
 153
153 -
 154
154 -
 155
155 -
 156
156 -
 157
157 -
 158
158 -
 159
159 -
 160
160 -
 161
161 -
 162
162 -
 163
163 -
 164
164 -
 165
165 -
 166
166 -
167
-
168
-
169
-
170
-
171
-
172
-
173
-
174
-
175
-
176
-
177
-
178
-
179
-
180
-
181
-
182
-
183
-
184
-
185
-
186
-
187
-
188
-
189
-
190
-
191
-
192
-
193
-
194
-
195
-
196
-
197
-
198
-
199
-
200
-
201
-
202
-
203
-
204
-
205
-
206
-
207
-
208
-
209
-
210
-
211
-
212
-
213
-
214
-
215
-
216
-
217
-
218
-
219
-
220
-
221
-
222
-
223
-
224
-
225
-
226
-
227
-
228
-
229
-
230
-
231
-
232
-
233
-
234
-
235
-
236
-
237
-
238
-
239
-
240
 |
 |

34
System Sales Growth
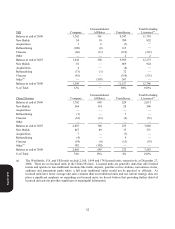
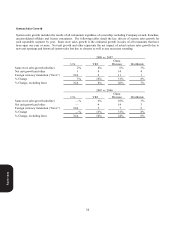
System sales growth includes the results of all restaurants regardless of ownership, including Company-owned, franchise,
unconsolidated affiliate and license restaurants. The following tables detail the key drivers of system sales growth for
each reportable segment by year. Same store sales growth is the estimated growth in sales of all restaurants that have
been open one year or more. Net unit growth and other represents the net impact of actual system sales growth due to
new unit openings and historical system sales lost due to closures as well as any necessary rounding.
2008 vs. 2007
U.S. YRI
China
Division Worldwide
Same store sales growth (decline) 2% 4 % 6% 3%
Net unit growth and other 1 4 14 4
Foreign currency translation (“forex”) N/A 2 11 1
% Change 3% 10 % 31 % 8 %
% Change, excluding forex N/A 8 % 20 % 7 %
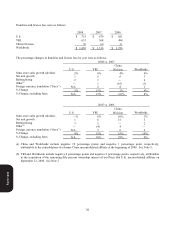
2007 vs. 2006
U.S. YRI
China
Division Worldwide
Same store sales growth (decline)
—
% 6% 10% 3%
Net unit growth and other
—
4 14 3
Foreign currency translation (“forex”) N/A 5 7 2
% Change
—
% 15% 31% 8%
% Change, excluding forex N/A 10% 24% 6%
Form 10-K