Pizza Hut 2008 Annual Report Download - page 66
Download and view the complete annual report
Please find page 66 of the 2008 Pizza Hut annual report below. You can navigate through the pages in the report by either clicking on the pages listed below, or by using the keyword search tool below to find specific information within the annual report.-
 1
1 -
2
-
3
-
4
-
5
-
6
-
7
-
8
-
9
-
10
-
11
-
12
-
13
-
14
-
15
-
16
-
17
-
18
-
19
-
20
-
21
-
22
-
23
-
24
-
25
-
26
-
27
-
28
-
29
-
30
-
31
-
32
-
33
-
34
-
35
-
36
-
37
-
38
-
39
-
40
-
41
-
42
-
43
-
44
-
45
-
46
-
47
-
48
-
49
-
50
-
51
-
52
-
53
-
54
-
55
-
 56
56 -
 57
57 -
 58
58 -
 59
59 -
 60
60 -
 61
61 -
 62
62 -
 63
63 -
 64
64 -
 65
65 -
 66
66 -
 67
67 -
 68
68 -
 69
69 -
 70
70 -
 71
71 -
 72
72 -
 73
73 -
 74
74 -
 75
75 -
 76
76 -
77
-
78
-
79
-
80
-
81
-
82
-
83
-
84
-
85
-
86
-
87
-
88
-
89
-
90
-
91
-
92
-
93
-
94
-
95
-
96
-
97
-
98
-
99
-
100
-
101
-
102
-
103
-
104
-
105
-
106
-
107
-
108
-
109
-
110
-
111
-
112
-
113
-
114
-
115
-
116
-
117
-
118
-
119
-
120
-
121
-
122
-
123
-
124
-
125
-
126
-
127
-
128
-
129
-
130
-
131
-
132
-
133
-
134
-
135
-
136
-
137
-
138
-
139
-
140
-
141
-
142
-
143
-
144
-
145
-
146
-
147
-
148
-
149
-
150
-
151
-
152
-
153
-
154
-
155
-
156
-
157
-
158
-
159
-
160
-
161
-
162
-
163
-
164
-
165
-
166
-
167
-
168
-
169
-
170
-
171
-
172
-
173
-
174
-
175
-
176
-
177
-
178
-
179
-
180
-
181
-
182
-
183
-
184
-
185
-
186
-
187
-
188
-
189
-
190
-
191
-
192
-
193
-
194
-
195
-
196
-
197
-
198
-
199
-
200
-
201
-
202
-
203
-
204
-
205
-
206
-
207
-
208
-
209
-
210
-
211
-
212
-
213
-
214
-
215
-
216
-
217
-
218
-
219
-
220
-
221
-
222
-
223
-
224
-
225
-
226
-
227
-
228
-
229
-
230
-
231
-
232
-
233
-
234
-
235
-
236
-
237
-
238
-
239
-
240
 |
 |

23MAR200920294881
completed on launch of Taco Bell internationally. Based on this performance, the committee approved a
150 Individual Performance Factor for Mr. Allan.
For Mr. Creed, the Compensation Committee determined that his overall individual performance for
2008 was significantly above target based upon Taco Bell US exceeding its profit plan and system sales
growth measure, as well as Mr. Creed’s strong leadership in implementing the Why Pay More strategy,
improved transaction growth, implementation of new products and pipeline development. Based on this
performance, the Committee approved a 140 Individual Performance Factor for Mr. Creed.
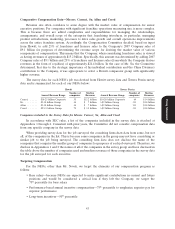
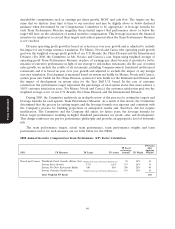
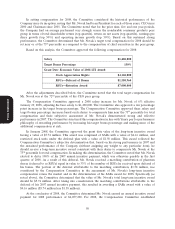
Application of Annual Incentive Program Formula to Named Executive Officers
Based on the Committee’s determinations as described above, the following table sets forth the
annual incentive formula and the calculation of annual incentive for each NEO.
Individual
Annual Bonus Team Performance Performance
Formula: Base Salary ⍥Target % ⍥Factor ⍥Factor = Bonus Award
Minimum—0% Minimum—0% Minimum—0%
Maximum—200% Maximum—150% Maximum—300%
Novak $1,400,000 ǂ150% ǂ138% ǂ140% = $4,057,200
Carucci $675,000 ǂ90% ǂ138% ǂ135% = $1,131,773
Allan $775,000 ǂ115% ǂ147% ǂ150% = $1,965,206
Su $775,000 ǂ115% ǂ129% ǂ140% = $1,609,598
Creed $620,000 ǂ85% ǂ123% ǂ140% = $907,494
Note: Messrs. Allan, Su and Creed’s team performance factor is based on 75% of their Division team
performance factor and 25% of the consolidated team performance factor.
Long-term Incentive Compensation
Proxy Statement
The principal purpose of our long-term incentive compensation program (‘‘LTI Plan’’) is to motivate
our executives to help us achieve our long-range performance goals that will enhance our value and, as a
result, enhance the price of our stock and our shareholders’ returns on their investments. The long-term
incentive philosophy is to target the 50th percentile of the companies in the survey data for executives
(other than our CEO) who are achieving their ownership guidelines.
Under our long-term incentive (‘‘LTI’’) Plan, our executive officers are awarded long-term incentives
in the form of non-qualified stock options or stock settled stock appreciation rights (‘‘SARs’’). The type of
award granted is based upon the executives’ local tax jurisdiction. Each year the Committee reviews the
mix of long-term incentives to determine if it is appropriate to continue using 100% stock options and
SARs as the long-term incentive vehicle. The Committee has chosen to use stock options and SARs
because they emphasize YUM’s focus on long-term growth, they reward employees only if the stock price
goes up and they align Restaurant General Managers and senior management on the same equity incentive
program. Long-term incentive award ranges are established based upon the survey data. In general, our
stock options and SARs have ten-year terms and vest 25% per year over four years.
For each named executive officer other than Mr. Novak, the 2008 Stock Option/SARs grant was
awarded based on the individual’s achievement of his stock ownership guidelines and the Compensation
Committee’s subjective assessment of each executive’s performance and consideration of the survey data.
The Committee based its assessment on factors considered with respect to the evaluation of
Messrs. Carucci’s, Su’s, Allan’s, and Creed’s individual and team performance as noted at pages 45-48 as
well as their expected contributions in future years. The Committee did not assign a weight to any
particular item.
48