Pizza Hut 2008 Annual Report Download - page 164
Download and view the complete annual report
Please find page 164 of the 2008 Pizza Hut annual report below. You can navigate through the pages in the report by either clicking on the pages listed below, or by using the keyword search tool below to find specific information within the annual report.-
 1
1 -
2
-
3
-
4
-
5
-
6
-
7
-
8
-
9
-
10
-
11
-
12
-
13
-
14
-
15
-
16
-
17
-
18
-
19
-
20
-
21
-
22
-
23
-
24
-
25
-
26
-
27
-
28
-
29
-
30
-
31
-
32
-
33
-
34
-
35
-
36
-
37
-
38
-
39
-
40
-
41
-
42
-
43
-
44
-
45
-
46
-
47
-
48
-
49
-
50
-
51
-
52
-
53
-
54
-
55
-
56
-
57
-
58
-
59
-
60
-
61
-
62
-
63
-
64
-
65
-
66
-
67
-
68
-
69
-
70
-
71
-
72
-
73
-
74
-
75
-
76
-
77
-
78
-
79
-
80
-
81
-
82
-
83
-
84
-
85
-
86
-
87
-
88
-
89
-
90
-
91
-
92
-
93
-
94
-
95
-
96
-
97
-
98
-
99
-
100
-
101
-
102
-
103
-
104
-
105
-
106
-
107
-
108
-
109
-
110
-
111
-
112
-
113
-
114
-
115
-
116
-
117
-
118
-
119
-
120
-
121
-
122
-
123
-
124
-
125
-
126
-
127
-
128
-
129
-
130
-
131
-
132
-
133
-
134
-
135
-
136
-
137
-
138
-
139
-
140
-
141
-
142
-
143
-
144
-
145
-
146
-
147
-
148
-
149
-
150
-
151
-
152
-
153
-
 154
154 -
 155
155 -
 156
156 -
 157
157 -
 158
158 -
 159
159 -
 160
160 -
 161
161 -
 162
162 -
 163
163 -
 164
164 -
 165
165 -
 166
166 -
 167
167 -
 168
168 -
 169
169 -
 170
170 -
 171
171 -
 172
172 -
 173
173 -
 174
174 -
175
-
176
-
177
-
178
-
179
-
180
-
181
-
182
-
183
-
184
-
185
-
186
-
187
-
188
-
189
-
190
-
191
-
192
-
193
-
194
-
195
-
196
-
197
-
198
-
199
-
200
-
201
-
202
-
203
-
204
-
205
-
206
-
207
-
208
-
209
-
210
-
211
-
212
-
213
-
214
-
215
-
216
-
217
-
218
-
219
-
220
-
221
-
222
-
223
-
224
-
225
-
226
-
227
-
228
-
229
-
230
-
231
-
232
-
233
-
234
-
235
-
236
-
237
-
238
-
239
-
240
 |
 |

42
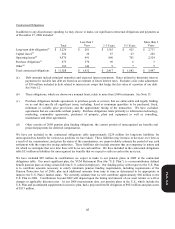
Adjustments to reserves and prior years include the effects of the reconciliation of income tax amounts recorded in our
Consolidated Statements of Income to amounts reflected on our tax returns, including any adjustments to the Consolidated
Balance Sheets. Adjustments to reserves and prior years also includes changes in tax reserves, including interest thereon,
established for potential exposure we may incur if a taxing authority takes a position on a matter contrary to our position.
We evaluate these reserves on a quarterly basis to insure that they have been appropriately adjusted for events, including
audit settlements that we believe may impact our exposure.
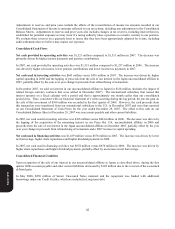
Consolidated Cash Flows
Net cash provided by operating activities was $1,521 million compared to $1,551 million in 2007. The decrease was
primarily driven by higher interest payments and pension contributions.
In 2007, net cash provided by operating activities was $1,551 million compared to $1,257 million in 2006. The increase
was driven by higher net income, lower pension contributions and lower income tax payments in 2007.
Net cash used in investing activities was $641 million versus $416 million in 2007. The increase was driven by higher
capital spending in 2008 and the lapping of proceeds from the sale of our interest in the Japan unconsolidated affiliate in
2007, partially offset by the year over year change in proceeds from refranchising of restaurants.
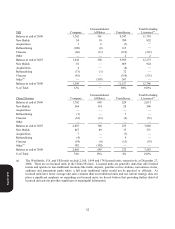
In December 2007, we sold our interest in our unconsolidated affiliate in Japan for $128 million (includes the impact of
related foreign currency contracts that were settled in December 2007). The international subsidiary that owned this
interest operates on a fiscal calendar with a period end that is approximately one month earlier than our consolidated
period close. Thus, consistent with our historical treatment of events occurring during the lag period, the pre-tax gain on
the sale of this investment of $100 million was recorded in the first quarter of 2008. However, the cash proceeds from
this transaction were transferred from our international subsidiary to the U.S. in December 2007 and were thus reported
on our Consolidated Statement of Cash Flows for the year ended December 29, 2007. The offset to this cash on our
Consolidated Balance Sheet at December 29, 2007 was in accounts payable and other current liabilities.
In 2007, net cash used in investing activities was $416 million versus $434 million in 2006. The decrease was driven by
the lapping of the acquisition of the remaining interest in our Pizza Hut U.K. unconsolidated affiliate in 2006 and
proceeds from the sale of our interest in the Japan unconsolidated affiliate in December 2007, partially offset by the year
over year change in proceeds from refranchising of restaurants and a 2007 increase in capital spending.
Net cash used in financing activities was $1,459 million versus $678 million in 2007. The increase was driven by lower
net borrowings, higher share repurchases and higher dividend payments in 2008.
In 2007, net cash used in financing activities was $678 million versus $670 million in 2006. The increase was driven by
higher share repurchases and higher dividend payments, partially offset by an increase in net borrowings.
Consolidated Financial Condition
Upon recognition of the sale of our interest in our unconsolidated affiliate in Japan, as described above, during the first
quarter 2008 accounts payable and other current liabilities decreased by $128 million due to the reversal of the associated
deferred gain.
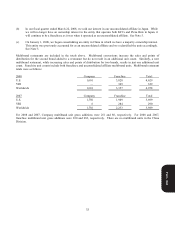
In May 2008, $250 million of Senior Unsecured Notes matured, and the repayment was funded with additional
borrowings under our Credit Facility, which are included in Long-term debt.
Form 10-K