Pizza Hut 2008 Annual Report Download - page 148
Download and view the complete annual report
Please find page 148 of the 2008 Pizza Hut annual report below. You can navigate through the pages in the report by either clicking on the pages listed below, or by using the keyword search tool below to find specific information within the annual report.-
 1
1 -
2
-
3
-
4
-
5
-
6
-
7
-
8
-
9
-
10
-
11
-
12
-
13
-
14
-
15
-
16
-
17
-
18
-
19
-
20
-
21
-
22
-
23
-
24
-
25
-
26
-
27
-
28
-
29
-
30
-
31
-
32
-
33
-
34
-
35
-
36
-
37
-
38
-
39
-
40
-
41
-
42
-
43
-
44
-
45
-
46
-
47
-
48
-
49
-
50
-
51
-
52
-
53
-
54
-
55
-
56
-
57
-
58
-
59
-
60
-
61
-
62
-
63
-
64
-
65
-
66
-
67
-
68
-
69
-
70
-
71
-
72
-
73
-
74
-
75
-
76
-
77
-
78
-
79
-
80
-
81
-
82
-
83
-
84
-
85
-
86
-
87
-
88
-
89
-
90
-
91
-
92
-
93
-
94
-
95
-
96
-
97
-
98
-
99
-
100
-
101
-
102
-
103
-
104
-
105
-
106
-
107
-
108
-
109
-
110
-
111
-
112
-
113
-
114
-
115
-
116
-
117
-
118
-
119
-
120
-
121
-
122
-
123
-
124
-
125
-
126
-
127
-
128
-
129
-
130
-
131
-
132
-
133
-
134
-
135
-
136
-
137
-
 138
138 -
 139
139 -
 140
140 -
 141
141 -
 142
142 -
 143
143 -
 144
144 -
 145
145 -
 146
146 -
 147
147 -
 148
148 -
 149
149 -
 150
150 -
 151
151 -
 152
152 -
 153
153 -
 154
154 -
 155
155 -
 156
156 -
 157
157 -
 158
158 -
159
-
160
-
161
-
162
-
163
-
164
-
165
-
166
-
167
-
168
-
169
-
170
-
171
-
172
-
173
-
174
-
175
-
176
-
177
-
178
-
179
-
180
-
181
-
182
-
183
-
184
-
185
-
186
-
187
-
188
-
189
-
190
-
191
-
192
-
193
-
194
-
195
-
196
-
197
-
198
-
199
-
200
-
201
-
202
-
203
-
204
-
205
-
206
-
207
-
208
-
209
-
210
-
211
-
212
-
213
-
214
-
215
-
216
-
217
-
218
-
219
-
220
-
221
-
222
-
223
-
224
-
225
-
226
-
227
-
228
-
229
-
230
-
231
-
232
-
233
-
234
-
235
-
236
-
237
-
238
-
239
-
240
 |
 |

26
Significant Known Events, Trends or Uncertainties Impacting or Expected to Impact Comparisons of Reported or
Future Results
The following factors impacted comparability of operating performance for the years ended December 27, 2008,
December 29, 2007 and December 30, 2006 and could impact comparability with our results in 2009.
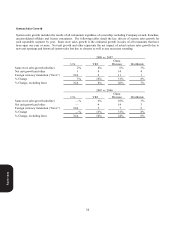
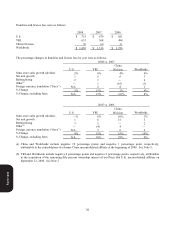
U.S. Restaurant Profit
Our U.S. restaurant margin as a percentage of sales decreased 0.8 percentage points in 2008 and decreased 1.3 percentage
points in 2007. These decreases were the primary drivers in the U.S. Operating Profit declines of 6% and 3% for the years
ended December 27, 2008 and December 29, 2007, respectively.
Restaurant profit in dollar terms was negatively impacted by $119 million of commodity inflation for the full year 2008.
Additionally, restaurant profit in 2008 was negatively impacted by $30 million due to higher property and casualty self
insurance expense, exclusive of the estimated reduction due to refranchised stores, as we lapped favorability in 2007.
These decreases were partially offset by Company same store sales growth of 3% resulting from pricing actions we have
taken.
In 2007, restaurant profit was negatively impacted versus 2006 by Company same store sales declines of 3% (primarily
due to Taco Bell) and $44 million of commodity inflation. This unfavorability was partially offset by $27 million of
lower self-insured property and casualty insurance expense, exclusive of the estimated reduction due to refranchised
stores, driven by improved loss trends.
We anticipate that the U.S. restaurant margin as a percentage of sales will improve approximately 1% for the full year
2009 as a result of pricing actions we have taken and the moderation of commodity inflation.
China Restaurant Profit
China Division restaurant margin as a percentage of sales was 18.4%, 20.1% and 20.4% for 2008, 2007 and 2006,
respectively. The declines in 2008 and 2007 were driven by commodity inflation, primarily chicken, of approximately
$78 million and $34 million, respectively, and higher labor costs. The decreases were partially offset by the impact of
same store sales growth on restaurant margin. In the China Division, we expect that commodity inflation will moderate as
2009 progresses and restaurant margin will be at least flat versus 2008.
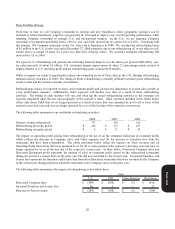
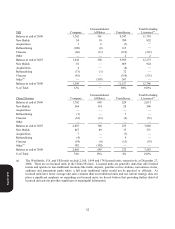
Impact of Foreign Currency Translation on Operating Profit
Changes in foreign currency exchange rates positively impacted the translation of our foreign currency denominated
Operating Profit in our International and China Divisions by $9 million and $41 million, respectively, for the year ended
December 27, 2008 and $24 million and $19 million, respectively, for the year ended December 29, 2007. In 2009, we
currently expect foreign currency translation to have a significant negative impact on our reported International Division
Operating Profit and no significant impact on our reported China Division Operating Profit. Given the nature and
volatility of the foreign currency markets the full year forecasted foreign currency impact is difficult to quantify.
However, for the first quarter of 2009 we currently expect a $20 million negative impact on YRI’s Operating Profit and a
similar impact for the second quarter of 2009.
Form 10-K