Pizza Hut 2008 Annual Report Download - page 193
Download and view the complete annual report
Please find page 193 of the 2008 Pizza Hut annual report below. You can navigate through the pages in the report by either clicking on the pages listed below, or by using the keyword search tool below to find specific information within the annual report.-
 1
1 -
2
-
3
-
4
-
5
-
6
-
7
-
8
-
9
-
10
-
11
-
12
-
13
-
14
-
15
-
16
-
17
-
18
-
19
-
20
-
21
-
22
-
23
-
24
-
25
-
26
-
27
-
28
-
29
-
30
-
31
-
32
-
33
-
34
-
35
-
36
-
37
-
38
-
39
-
40
-
41
-
42
-
43
-
44
-
45
-
46
-
47
-
48
-
49
-
50
-
51
-
52
-
53
-
54
-
55
-
56
-
57
-
58
-
59
-
60
-
61
-
62
-
63
-
64
-
65
-
66
-
67
-
68
-
69
-
70
-
71
-
72
-
73
-
74
-
75
-
76
-
77
-
78
-
79
-
80
-
81
-
82
-
83
-
84
-
85
-
86
-
87
-
88
-
89
-
90
-
91
-
92
-
93
-
94
-
95
-
96
-
97
-
98
-
99
-
100
-
101
-
102
-
103
-
104
-
105
-
106
-
107
-
108
-
109
-
110
-
111
-
112
-
113
-
114
-
115
-
116
-
117
-
118
-
119
-
120
-
121
-
122
-
123
-
124
-
125
-
126
-
127
-
128
-
129
-
130
-
131
-
132
-
133
-
134
-
135
-
136
-
137
-
138
-
139
-
140
-
141
-
142
-
143
-
144
-
145
-
146
-
147
-
148
-
149
-
150
-
151
-
152
-
153
-
154
-
155
-
156
-
157
-
158
-
159
-
160
-
161
-
162
-
163
-
164
-
165
-
166
-
167
-
168
-
169
-
170
-
171
-
172
-
173
-
174
-
175
-
176
-
177
-
178
-
179
-
180
-
181
-
182
-
 183
183 -
 184
184 -
 185
185 -
 186
186 -
 187
187 -
 188
188 -
 189
189 -
 190
190 -
 191
191 -
 192
192 -
 193
193 -
 194
194 -
 195
195 -
 196
196 -
 197
197 -
 198
198 -
 199
199 -
 200
200 -
 201
201 -
 202
202 -
 203
203 -
204
-
205
-
206
-
207
-
208
-
209
-
210
-
211
-
212
-
213
-
214
-
215
-
216
-
217
-
218
-
219
-
220
-
221
-
222
-
223
-
224
-
225
-
226
-
227
-
228
-
229
-
230
-
231
-
232
-
233
-
234
-
235
-
236
-
237
-
238
-
239
-
240
 |
 |

71
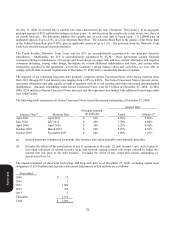
Additionally, the Company recognized pre-tax expenses of $7 million related to investments in our U.S. Brands.
We are not including the impacts of these U.S. business transformation measures in our U.S. segment for performance
reporting purposes as we do not believe they are indicative of our ongoing operations.
Pizza Hut United Kingdom Acquisition
On September 12, 2006, we completed the acquisition of the remaining fifty percent ownership interest of our Pizza Hut
U.K. unconsolidated affiliate for $187 million in cash, including transaction costs and prior to $9 million of cash assumed.
This unconsolidated affiliate owned more than 500 restaurants in the U.K. The acquisition was driven by growth
opportunities we see in the market and the desire of our former partner in the unconsolidated affiliate to refocus its
business to other industry sectors. Prior to this acquisition, we accounted for our ownership interest under the equity
method of accounting.
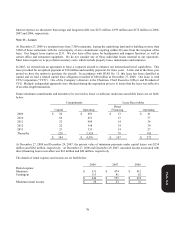
Under the equity method of accounting, we reported our fifty percent share of the net income of the unconsolidated
affiliate (after interest expense and income taxes) as Other (income) expense in the Consolidated Statements of Income.
We also recorded a franchise fee for the royalty received from the stores owned by the unconsolidated affiliate. Since the
date of acquisition, we have reported Company sales and the associated restaurant costs, G&A expense, interest expense
and income taxes associated with the restaurants previously owned by the unconsolidated affiliate in the appropriate line
items of our Consolidated Statements of Income. We no longer record franchise fee income for the restaurants previously
owned by the unconsolidated affiliate nor do we report other income under the equity method of accounting. As a result
of this acquisition, Company sales and restaurant profit increased $576 million and $59 million, respectively, franchise
fees decreased $19 million and G&A expenses increased $33 million in 2007 compared to 2006.
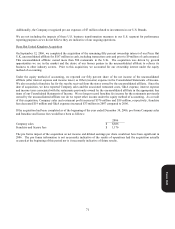
If the acquisition had been completed as of the beginning of the year ended December 30, 2006, pro forma Company sales
and franchise and license fees would have been as follows:
2006
Company sales $ 8,886
Franchise and license fees $ 1,176
The pro forma impact of the acquisition on net income and diluted earnings per share would not have been significant in
2006. The pro forma information is not necessarily indicative of the results of operations had the acquisition actually
occurred at the beginning of this period nor is it necessarily indicative of future results.
Form 10-K