Pizza Hut 2008 Annual Report Download - page 152
Download and view the complete annual report
Please find page 152 of the 2008 Pizza Hut annual report below. You can navigate through the pages in the report by either clicking on the pages listed below, or by using the keyword search tool below to find specific information within the annual report.-
 1
1 -
2
-
3
-
4
-
5
-
6
-
7
-
8
-
9
-
10
-
11
-
12
-
13
-
14
-
15
-
16
-
17
-
18
-
19
-
20
-
21
-
22
-
23
-
24
-
25
-
26
-
27
-
28
-
29
-
30
-
31
-
32
-
33
-
34
-
35
-
36
-
37
-
38
-
39
-
40
-
41
-
42
-
43
-
44
-
45
-
46
-
47
-
48
-
49
-
50
-
51
-
52
-
53
-
54
-
55
-
56
-
57
-
58
-
59
-
60
-
61
-
62
-
63
-
64
-
65
-
66
-
67
-
68
-
69
-
70
-
71
-
72
-
73
-
74
-
75
-
76
-
77
-
78
-
79
-
80
-
81
-
82
-
83
-
84
-
85
-
86
-
87
-
88
-
89
-
90
-
91
-
92
-
93
-
94
-
95
-
96
-
97
-
98
-
99
-
100
-
101
-
102
-
103
-
104
-
105
-
106
-
107
-
108
-
109
-
110
-
111
-
112
-
113
-
114
-
115
-
116
-
117
-
118
-
119
-
120
-
121
-
122
-
123
-
124
-
125
-
126
-
127
-
128
-
129
-
130
-
131
-
132
-
133
-
134
-
135
-
136
-
137
-
138
-
139
-
140
-
141
-
 142
142 -
 143
143 -
 144
144 -
 145
145 -
 146
146 -
 147
147 -
 148
148 -
 149
149 -
 150
150 -
 151
151 -
 152
152 -
 153
153 -
 154
154 -
 155
155 -
 156
156 -
 157
157 -
 158
158 -
 159
159 -
 160
160 -
 161
161 -
 162
162 -
163
-
164
-
165
-
166
-
167
-
168
-
169
-
170
-
171
-
172
-
173
-
174
-
175
-
176
-
177
-
178
-
179
-
180
-
181
-
182
-
183
-
184
-
185
-
186
-
187
-
188
-
189
-
190
-
191
-
192
-
193
-
194
-
195
-
196
-
197
-
198
-
199
-
200
-
201
-
202
-
203
-
204
-
205
-
206
-
207
-
208
-
209
-
210
-
211
-
212
-
213
-
214
-
215
-
216
-
217
-
218
-
219
-
220
-
221
-
222
-
223
-
224
-
225
-
226
-
227
-
228
-
229
-
230
-
231
-
232
-
233
-
234
-
235
-
236
-
237
-
238
-
239
-
240
 |
 |

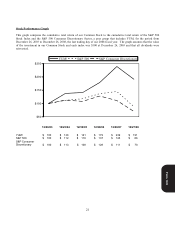
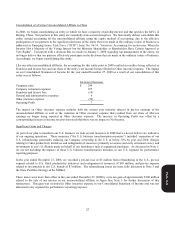
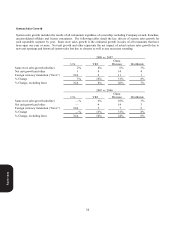
30
2007
U.S. YRI China Division Worldwide
Decreased Company sales $(374) $ (144) $
(3) $
(521)
Increased Franchise and license fees 20 9
—
29
Decrease in Total revenues $(354) $ (135) $
(3) $
(492)
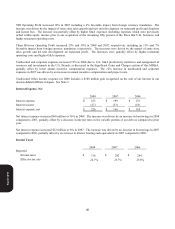
The following table summarizes the estimated impact on Operating Profit of refranchising:
2007
U.S. YRI China Division Worldwide
Decreased Restaurant profit $(37) $ (7) $
—
$
(44)
Increased Franchise and license fees 20 9
—
29
Decreased G&A 7 3
—
10
Increase (decrease) in Operating Profit $(10) $ 5 $
—
$
(5)
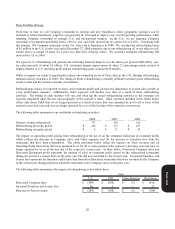
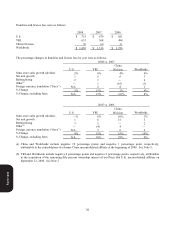
Results of Operations
2008
% B/(W)
vs. 2007 2007
% B/(W)
vs. 2006
Company sales $ 9,843 8 $ 9,100 9
Franchise and license fees 1,436 9
1,316 10
Total revenues $11,279 8 $
10,416 9
Company restaurant profit $ 1,378 4 $ 1,327 4
% of Company sales 14.0% (0.6) ppts. 14.6% (0.6 ) ppts.
Operating profit 1,506 11 1,357 8
Interest expense, net 226 (36) 166 (8)
Income tax provision 316 (12) 282 1
Net income $964 6 $
909 10
Diluted earnings per share(a) $ 1.96 17 $ 1.68 15
(a) See Note 4 for the number of shares used in this calculation.
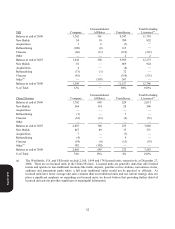
2008
U.S. YRI China Division Worldwide
Decreased Restaurant profit $(19) $ (8) $ (1) $
(28)
Increased Franchise and license fees 16 6
—
22
Decreased G&A 7 1
—
8
Increase (decrease) in Operating Profit $4 $ (1) $ (1) $ 2
Form 10-K