Pizza Hut 2008 Annual Report Download - page 144
Download and view the complete annual report
Please find page 144 of the 2008 Pizza Hut annual report below. You can navigate through the pages in the report by either clicking on the pages listed below, or by using the keyword search tool below to find specific information within the annual report.-
 1
1 -
2
-
3
-
4
-
5
-
6
-
7
-
8
-
9
-
10
-
11
-
12
-
13
-
14
-
15
-
16
-
17
-
18
-
19
-
20
-
21
-
22
-
23
-
24
-
25
-
26
-
27
-
28
-
29
-
30
-
31
-
32
-
33
-
34
-
35
-
36
-
37
-
38
-
39
-
40
-
41
-
42
-
43
-
44
-
45
-
46
-
47
-
48
-
49
-
50
-
51
-
52
-
53
-
54
-
55
-
56
-
57
-
58
-
59
-
60
-
61
-
62
-
63
-
64
-
65
-
66
-
67
-
68
-
69
-
70
-
71
-
72
-
73
-
74
-
75
-
76
-
77
-
78
-
79
-
80
-
81
-
82
-
83
-
84
-
85
-
86
-
87
-
88
-
89
-
90
-
91
-
92
-
93
-
94
-
95
-
96
-
97
-
98
-
99
-
100
-
101
-
102
-
103
-
104
-
105
-
106
-
107
-
108
-
109
-
110
-
111
-
112
-
113
-
114
-
115
-
116
-
117
-
118
-
119
-
120
-
121
-
122
-
123
-
124
-
125
-
126
-
127
-
128
-
129
-
130
-
131
-
132
-
133
-
 134
134 -
 135
135 -
 136
136 -
 137
137 -
 138
138 -
 139
139 -
 140
140 -
 141
141 -
 142
142 -
 143
143 -
 144
144 -
 145
145 -
 146
146 -
 147
147 -
 148
148 -
 149
149 -
 150
150 -
 151
151 -
 152
152 -
 153
153 -
 154
154 -
155
-
156
-
157
-
158
-
159
-
160
-
161
-
162
-
163
-
164
-
165
-
166
-
167
-
168
-
169
-
170
-
171
-
172
-
173
-
174
-
175
-
176
-
177
-
178
-
179
-
180
-
181
-
182
-
183
-
184
-
185
-
186
-
187
-
188
-
189
-
190
-
191
-
192
-
193
-
194
-
195
-
196
-
197
-
198
-
199
-
200
-
201
-
202
-
203
-
204
-
205
-
206
-
207
-
208
-
209
-
210
-
211
-
212
-
213
-
214
-
215
-
216
-
217
-
218
-
219
-
220
-
221
-
222
-
223
-
224
-
225
-
226
-
227
-
228
-
229
-
230
-
231
-
232
-
233
-
234
-
235
-
236
-
237
-
238
-
239
-
240
 |
 |

22
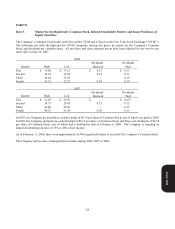
Item 6. Selected Financial Data.
Selected Financial Data
YUM! Brands, Inc. and Subsidiaries
(in millions, except per share and unit amounts)
Fiscal Yea
r
2008 2007 2006 2005 2004
Summar
y
of O
p
erations
R
evenues
Com
p
an
y
sales $ 9
,
843 $ 9
,
100 $ 8
,
365 $ 8
,
225 $ 7
,
992
Franchise and license fees 1
,
436 1
,
316 1
,
196 1
,
124 1
,
019
Total 11
,
279 10
,
416 9
,
561 9
,
349 9
,
011
Closures and im
p
airment income
(
ex
p
enses
)
(a)
(
43
)
(
35
)
(
59
)
(
62
)
(
38
)
R
efranchising gain (loss)(a) 5 11 24 43 12
O
p
eratin
g
Profi
t
(b) 1,506 1,357 1,262 1,153 1,155
Interest expense, ne
t
226 166 154 127 129
Income before income taxes 1,280 1,191 1,108 1,026 1,026
N
et income 964 909 824 762 740
B
asic earnings per common share(c) 2.03 1.74 1.51 1.33 1.27
D
iluted earnings per common share(c) 1.96 1.68 1.46 1.28 1.21
Cash Flow Data
P
rovided by operating activities $ 1,521 $ 1,551 $ 1,257 $ 1,233 $ 1,186
Capital spending, excluding acquisitions 935 726 572 609 645
P
roceeds from refranchising of restaurants 266 117 257 145 140
R
epurchase shares of Common Stoc
k
1,628 1,410 983 1,056 569
D
ividends paid on Common Stock 322 273 144 123 58
B
alance Sheet
Total assets $ 6,527 $ 7,188 $ 6,368 $ 5,797 $ 5,696
L
ong-term debt 3,564 2,924 2,045 1,649 1,731
Total deb
t
3,589 3,212 2,272 1,860 1,742
Other Data
N
umber of stores at year end
Company 7,568 7,625 7,736 7,587 7,743
Unconsolidated Affiliates 645 1,314 1,206 1,648 1,662
Franchisees 25,911 24,297 23,516 22,666 21,858
Licensees 2,168 2,109 2,137 2,376 2,345
S
y
ste
m
36,292 35,345 34,595 34,277 33,608
U
.S. same store sales growth(d) 2% — 1% 3% 3%
Y
RI system sales growth(d)
Reported 10% 15% 7% 9% 14%
Local currency(e) 8% 10% 7% 6% 6%
China Division system sales growth(d)
Reported 31% 31% 26% 13% 23%
Local currency(e) 20% 24% 23% 11% 23%
Shares outstanding at year end(c) 459 499 530 556 581
Cash dividends declared per Common Stock(c) $ 0.72 $ 0.45 $ 0.43 $ 0.22 $ 0.15
M
arket
p
rice
p
er share at
y
ear end (c) $ 30.28 $ 38.54 $ 29.40 $ 23.44 $ 23.14
Form 10-K