Pizza Hut 2008 Annual Report Download - page 161
Download and view the complete annual report
Please find page 161 of the 2008 Pizza Hut annual report below. You can navigate through the pages in the report by either clicking on the pages listed below, or by using the keyword search tool below to find specific information within the annual report.-
 1
1 -
2
-
3
-
4
-
5
-
6
-
7
-
8
-
9
-
10
-
11
-
12
-
13
-
14
-
15
-
16
-
17
-
18
-
19
-
20
-
21
-
22
-
23
-
24
-
25
-
26
-
27
-
28
-
29
-
30
-
31
-
32
-
33
-
34
-
35
-
36
-
37
-
38
-
39
-
40
-
41
-
42
-
43
-
44
-
45
-
46
-
47
-
48
-
49
-
50
-
51
-
52
-
53
-
54
-
55
-
56
-
57
-
58
-
59
-
60
-
61
-
62
-
63
-
64
-
65
-
66
-
67
-
68
-
69
-
70
-
71
-
72
-
73
-
74
-
75
-
76
-
77
-
78
-
79
-
80
-
81
-
82
-
83
-
84
-
85
-
86
-
87
-
88
-
89
-
90
-
91
-
92
-
93
-
94
-
95
-
96
-
97
-
98
-
99
-
100
-
101
-
102
-
103
-
104
-
105
-
106
-
107
-
108
-
109
-
110
-
111
-
112
-
113
-
114
-
115
-
116
-
117
-
118
-
119
-
120
-
121
-
122
-
123
-
124
-
125
-
126
-
127
-
128
-
129
-
130
-
131
-
132
-
133
-
134
-
135
-
136
-
137
-
138
-
139
-
140
-
141
-
142
-
143
-
144
-
145
-
146
-
147
-
148
-
149
-
150
-
 151
151 -
 152
152 -
 153
153 -
 154
154 -
 155
155 -
 156
156 -
 157
157 -
 158
158 -
 159
159 -
 160
160 -
 161
161 -
 162
162 -
 163
163 -
 164
164 -
 165
165 -
 166
166 -
 167
167 -
 168
168 -
 169
169 -
 170
170 -
 171
171 -
172
-
173
-
174
-
175
-
176
-
177
-
178
-
179
-
180
-
181
-
182
-
183
-
184
-
185
-
186
-
187
-
188
-
189
-
190
-
191
-
192
-
193
-
194
-
195
-
196
-
197
-
198
-
199
-
200
-
201
-
202
-
203
-
204
-
205
-
206
-
207
-
208
-
209
-
210
-
211
-
212
-
213
-
214
-
215
-
216
-
217
-
218
-
219
-
220
-
221
-
222
-
223
-
224
-
225
-
226
-
227
-
228
-
229
-
230
-
231
-
232
-
233
-
234
-
235
-
236
-
237
-
238
-
239
-
240
 |
 |

39
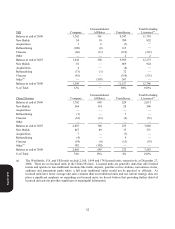
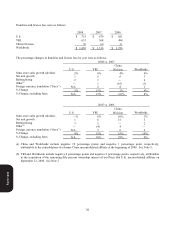
(a) On January 1, 2008 the Company began consolidating an entity in China in which we have a majority ownership
interest. See Note 5.
(b) Fiscal year 2008 reflects the gain recognized on the sale of our interest in our unconsolidated affiliate in Japan.
See Note 5.
(c) Fiscal years 2007 and 2006 reflect recognition of income associated with receipt of payments for a note
receivable arising from the 2005 sale of our fifty percent interest in the entity that operated almost all KFCs and
Pizza Huts in Poland and the Czech Republic to our then partner in the entity.
(d) Reflects an $8 million charge associated with the termination of a beverage agreement in the U.S. segment in
2006.
(e) Fiscal year 2007 reflects financial recoveries from settlements with insurance carriers related to a lawsuit settled
by Taco Bell Corporation in 2004.
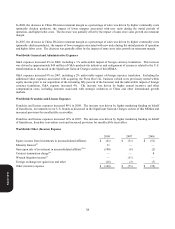
Worldwide Closure and Impairment Expenses and Refranchising (Gain) Loss
See the Store Portfolio Strategy section for more detail of our refranchising activity and Note 5 for a summary of the
components of facility actions by reportable operating segment.
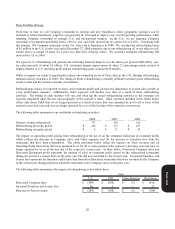
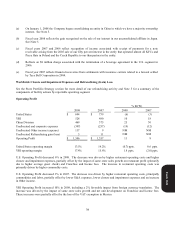
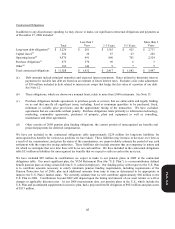
Operating Profit
% B/(W)
2008 2007 2008 2007
United States $ 694 $ 739 (6) (3)
YRI 528 480 10 18
China Division 469 375 25 30
Unallocated and corporate expenses (307) (257) (19) (12)
Unallocated Other income (expense) 117 9 NM NM
Unallocated Refranchising gain (loss) 5 11 NM NM
Operating Profit $ 1,506 $ 1,357 11 8
United States operating margin 13.5% 14.2% (0.7) ppts. 0.6 ppts.
YRI operating margin 17.4% 15.6% 1.8 ppts. (2.0) ppts.
U.S. Operating Profit decreased 6% in 2008. The decrease was driven by higher restaurant operating costs and higher
closure and impairment expenses, partially offset by the impact of same store sales growth on restaurant profit (primarily
due to higher average guest check) and Franchise and license fees. The increase in restaurant operating costs was
primarily driven by higher commodity costs.
U.S. Operating Profit decreased 3% in 2007. The decrease was driven by higher restaurant operating costs, principally
commodities and labor, partially offset by lower G&A expenses, lower closure and impairment expenses and an increase
in Other income.
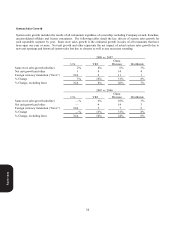
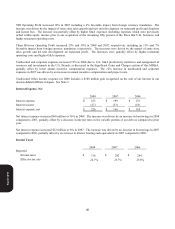
YRI Operating Profit increased 10% in 2008, including a 2% favorable impact from foreign currency translation. The
increase was driven by the impact of same store sales growth and net unit development on Franchise and license fees.
These increases were partially offset by the loss of the VAT exemption in Mexico.
Form 10-K