Pizza Hut 2008 Annual Report Download - page 68
Download and view the complete annual report
Please find page 68 of the 2008 Pizza Hut annual report below. You can navigate through the pages in the report by either clicking on the pages listed below, or by using the keyword search tool below to find specific information within the annual report.-
 1
1 -
2
-
3
-
4
-
5
-
6
-
7
-
8
-
9
-
10
-
11
-
12
-
13
-
14
-
15
-
16
-
17
-
18
-
19
-
20
-
21
-
22
-
23
-
24
-
25
-
26
-
27
-
28
-
29
-
30
-
31
-
32
-
33
-
34
-
35
-
36
-
37
-
38
-
39
-
40
-
41
-
42
-
43
-
44
-
45
-
46
-
47
-
48
-
49
-
50
-
51
-
52
-
53
-
54
-
55
-
56
-
57
-
 58
58 -
 59
59 -
 60
60 -
 61
61 -
 62
62 -
 63
63 -
 64
64 -
 65
65 -
 66
66 -
 67
67 -
 68
68 -
 69
69 -
 70
70 -
 71
71 -
 72
72 -
 73
73 -
 74
74 -
 75
75 -
 76
76 -
 77
77 -
 78
78 -
79
-
80
-
81
-
82
-
83
-
84
-
85
-
86
-
87
-
88
-
89
-
90
-
91
-
92
-
93
-
94
-
95
-
96
-
97
-
98
-
99
-
100
-
101
-
102
-
103
-
104
-
105
-
106
-
107
-
108
-
109
-
110
-
111
-
112
-
113
-
114
-
115
-
116
-
117
-
118
-
119
-
120
-
121
-
122
-
123
-
124
-
125
-
126
-
127
-
128
-
129
-
130
-
131
-
132
-
133
-
134
-
135
-
136
-
137
-
138
-
139
-
140
-
141
-
142
-
143
-
144
-
145
-
146
-
147
-
148
-
149
-
150
-
151
-
152
-
153
-
154
-
155
-
156
-
157
-
158
-
159
-
160
-
161
-
162
-
163
-
164
-
165
-
166
-
167
-
168
-
169
-
170
-
171
-
172
-
173
-
174
-
175
-
176
-
177
-
178
-
179
-
180
-
181
-
182
-
183
-
184
-
185
-
186
-
187
-
188
-
189
-
190
-
191
-
192
-
193
-
194
-
195
-
196
-
197
-
198
-
199
-
200
-
201
-
202
-
203
-
204
-
205
-
206
-
207
-
208
-
209
-
210
-
211
-
212
-
213
-
214
-
215
-
216
-
217
-
218
-
219
-
220
-
221
-
222
-
223
-
224
-
225
-
226
-
227
-
228
-
229
-
230
-
231
-
232
-
233
-
234
-
235
-
236
-
237
-
238
-
239
-
240
 |
 |

23MAR200920294881
In setting compensation for 2008, the Committee considered the historical performance of the
Company since its inception, noting that Mr. Novak had been President for each of those years, CEO since
2000 and Chairman since 2001. The Committee noted that for the prior nine, five and one year periods,
the Company had on average performed very strongly versus the nondurable consumer products peer
group in terms of total shareholder return (top quartile), return on net assets (top quartile), earnings per
share growth (top 50%) and operating income growth (top 50%). Based on this sustained strong
performance, the Committee determined that Mr. Novak’s target total compensation for 2008 should be
set near or at the 75th percentile as compared to the compensation of chief executives in the peer group.
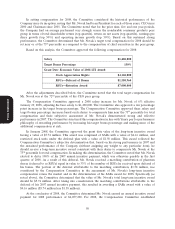
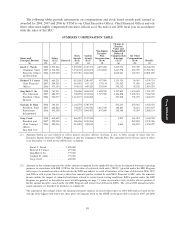
Based on this analysis, the Committee approved the following compensation for 2008:
Salary $1,400,000
Target Bonus Percentage 150%
Grant Date Economic Value of 2008 LTI Award:
Stock Appreciation Rights $4,160,000
RSUs—Deferral of Bonus $1,580,964
RSUs—Retention Award $7,000,000
After the adjustments described below, the Committee noted that the total target compensation for
Mr. Novak was at the 72nd percentile of the CEO peer group.
The Compensation Committee approved a 2008 salary increase for Mr. Novak of 6% effective
January 29, 2008, adjusting his base salary to $1,400,000. The Committee also approved a ten percentage
point increase in his target bonus percentage. The Compensation Committee approved these salary and
target bonus percentage increases based on its desire to compensate him near the 75th percentile for total
compensation and their subjective assessment of Mr. Novak’s demonstrated strong and effective
performance in 2007. The Committee structured this compensation in line with Yum’s pay for performance
Proxy Statement
philosophy of rewarding performance by increasing his target bonus percentage and making more of the
additional compensation at risk.
In January 2008, the Committee approved the grant date value of the long-term incentive award
having a value of $5.74 million. This award was comprised of SARs with a value of $4.16 million, and
restricted stock units under the deferral plan with a value of $1.58 million. This award reflected the
Compensation Committee’s subjective determination that, based on his strong performance in 2007 and
the sustained performance of the Company (without assigning any weight to any particular item), he
should receive a long-term incentive award consistent with their desire to compensate Mr. Novak at the
75th percentile for total compensation. In making this determination, the Committee noted that Mr. Novak
elected to defer 100% of his 2007 annual incentive payment, which was otherwise payable in the first
quarter of 2008. As a result of this deferral, Mr. Novak received a matching contribution of phantom
shares (referred to as RSUs) equal in value to 33% of the number of RSUs he received upon deferral of
his bonus. The portion of the deferral attributable to the matching contribution, $1.58 million, was
considered by the Compensation Committee in the assessment of Mr. Novak’s long-term incentive
compensation versus the market and in the determination of his SARs award for 2008. Specifically (as
noted above), the Committee determined that the value of Mr. Novak’s total long-term incentive award
should be $5.74 million. After taking into consideration the matching contributions attributable to the
deferral of his 2007 annual incentive payment, this resulted in awarding a SARs award with a value of
$4.16 million ($5.74 million less $1.58 million).
At the conclusion of 2008, the Committee determined Mr. Novak earned an annual incentive award
payment for 2008 performance of $4,057,200. For 2008, the Compensation Committee established
50