Pizza Hut 2008 Annual Report Download - page 210
Download and view the complete annual report
Please find page 210 of the 2008 Pizza Hut annual report below. You can navigate through the pages in the report by either clicking on the pages listed below, or by using the keyword search tool below to find specific information within the annual report.-
 1
1 -
2
-
3
-
4
-
5
-
6
-
7
-
8
-
9
-
10
-
11
-
12
-
13
-
14
-
15
-
16
-
17
-
18
-
19
-
20
-
21
-
22
-
23
-
24
-
25
-
26
-
27
-
28
-
29
-
30
-
31
-
32
-
33
-
34
-
35
-
36
-
37
-
38
-
39
-
40
-
41
-
42
-
43
-
44
-
45
-
46
-
47
-
48
-
49
-
50
-
51
-
52
-
53
-
54
-
55
-
56
-
57
-
58
-
59
-
60
-
61
-
62
-
63
-
64
-
65
-
66
-
67
-
68
-
69
-
70
-
71
-
72
-
73
-
74
-
75
-
76
-
77
-
78
-
79
-
80
-
81
-
82
-
83
-
84
-
85
-
86
-
87
-
88
-
89
-
90
-
91
-
92
-
93
-
94
-
95
-
96
-
97
-
98
-
99
-
100
-
101
-
102
-
103
-
104
-
105
-
106
-
107
-
108
-
109
-
110
-
111
-
112
-
113
-
114
-
115
-
116
-
117
-
118
-
119
-
120
-
121
-
122
-
123
-
124
-
125
-
126
-
127
-
128
-
129
-
130
-
131
-
132
-
133
-
134
-
135
-
136
-
137
-
138
-
139
-
140
-
141
-
142
-
143
-
144
-
145
-
146
-
147
-
148
-
149
-
150
-
151
-
152
-
153
-
154
-
155
-
156
-
157
-
158
-
159
-
160
-
161
-
162
-
163
-
164
-
165
-
166
-
167
-
168
-
169
-
170
-
171
-
172
-
173
-
174
-
175
-
176
-
177
-
178
-
179
-
180
-
181
-
182
-
183
-
184
-
185
-
186
-
187
-
188
-
189
-
190
-
191
-
192
-
193
-
194
-
195
-
196
-
197
-
198
-
199
-
 200
200 -
 201
201 -
 202
202 -
 203
203 -
 204
204 -
 205
205 -
 206
206 -
 207
207 -
 208
208 -
 209
209 -
 210
210 -
 211
211 -
 212
212 -
 213
213 -
 214
214 -
 215
215 -
 216
216 -
 217
217 -
 218
218 -
 219
219 -
 220
220 -
221
-
222
-
223
-
224
-
225
-
226
-
227
-
228
-
229
-
230
-
231
-
232
-
233
-
234
-
235
-
236
-
237
-
238
-
239
-
240
 |
 |

88
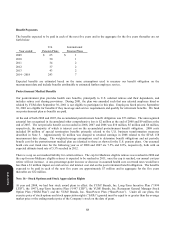
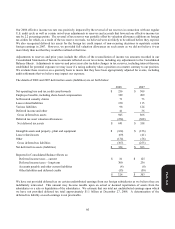
Benefit Payments
The benefits expected to be paid in each of the next five years and in the aggregate for the five years thereafter are set
forth below:
Year ended:
U.S.
Pension Plans
International
Pension Plans
2009 $ 65 $ 1
2010 50 1
2011 34 2
2012 37 2
2013 43 2
2014 - 2018 243 7
Expected benefits are estimated based on the same assumptions used to measure our benefit obligation on the
measurement date and include benefits attributable to estimated further employee service.
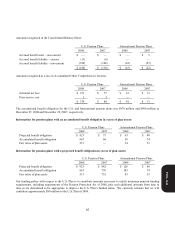
Postretirement Medical Benefits
Our postretirement plan provides health care benefits, principally to U.S. salaried retirees and their dependents, and
includes retiree cost sharing provisions. During 2001, the plan was amended such that any salaried employee hired or
rehired by YUM after September 30, 2001 is not eligible to participate in this plan. Employees hired prior to September
30, 2001 are eligible for benefits if they meet age and service requirements and qualify for retirement benefits. We fund
our postretirement plan as benefits are paid.
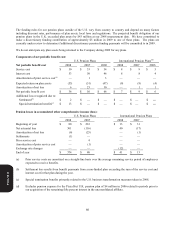
At the end of both 2008 and 2007, the accumulated postretirement benefit obligation was $73 million. The unrecognized
actuarial loss recognized in Accumulated other comprehensive loss is $2 million at the end of 2008 and $9 million at the
end of 2007. The net periodic benefit cost recorded in 2008, 2007 and 2006 was $10 million, $5 million and $6 million,
respectively, the majority of which is interest cost on the accumulated postretirement benefit obligation. 2008 costs
included $4 million of special termination benefits primarily related to the U.S. business transformation measures
described in Note 5. Approximately $2 million was charged to retained earnings in 2008 related to the SFAS 158
measurement date change. The weighted-average assumptions used to determine benefit obligations and net periodic
benefit cost for the postretirement medical plan are identical to those as shown for the U.S. pension plans. Our assumed
heath care cost trend rates for the following year as of 2008 and 2007 are 7.5% and 8.0%, respectively, both with an
expected ultimate trend rate of 5.5% reached in 2012.
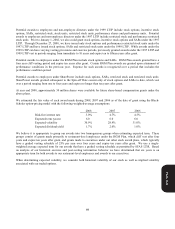
There is a cap on our medical liability for certain retirees. The cap for Medicare eligible retirees was reached in 2000 and
the cap for non-Medicare eligible retirees is expected to be reached in 2011; once the cap is reached, our annual cost per
retiree will not increase. A one-percentage-point increase or decrease in assumed health care cost trend rates would have
less than a $1 million impact on total service and interest cost and on the post retirement benefit obligation. The benefits
expected to be paid in each of the next five years are approximately $7 million and in aggregate for the five years
thereafter are $32 million.
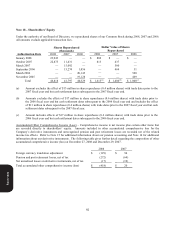
Note 16 – Stock Options and Stock Appreciation Rights
At year end 2008, we had four stock award plans in effect: the YUM! Brands, Inc. Long-Term Incentive Plan (“1999
LTIP”), the 1997 Long-Term Incentive Plan (“1997 LTIP”), the YUM! Brands, Inc. Restaurant General Manager Stock
Option Plan (“RGM Plan”) and the YUM! Brands, Inc. SharePower Plan (“SharePower”). Under all our plans, the
exercise price of stock options and stock appreciation rights (“SARs”) granted must be equal to or greater than the average
market price or the ending market price of the Company’s stock on the date of grant.
Form 10-K