Pizza Hut 2008 Annual Report Download - page 151
Download and view the complete annual report
Please find page 151 of the 2008 Pizza Hut annual report below. You can navigate through the pages in the report by either clicking on the pages listed below, or by using the keyword search tool below to find specific information within the annual report.-
 1
1 -
2
-
3
-
4
-
5
-
6
-
7
-
8
-
9
-
10
-
11
-
12
-
13
-
14
-
15
-
16
-
17
-
18
-
19
-
20
-
21
-
22
-
23
-
24
-
25
-
26
-
27
-
28
-
29
-
30
-
31
-
32
-
33
-
34
-
35
-
36
-
37
-
38
-
39
-
40
-
41
-
42
-
43
-
44
-
45
-
46
-
47
-
48
-
49
-
50
-
51
-
52
-
53
-
54
-
55
-
56
-
57
-
58
-
59
-
60
-
61
-
62
-
63
-
64
-
65
-
66
-
67
-
68
-
69
-
70
-
71
-
72
-
73
-
74
-
75
-
76
-
77
-
78
-
79
-
80
-
81
-
82
-
83
-
84
-
85
-
86
-
87
-
88
-
89
-
90
-
91
-
92
-
93
-
94
-
95
-
96
-
97
-
98
-
99
-
100
-
101
-
102
-
103
-
104
-
105
-
106
-
107
-
108
-
109
-
110
-
111
-
112
-
113
-
114
-
115
-
116
-
117
-
118
-
119
-
120
-
121
-
122
-
123
-
124
-
125
-
126
-
127
-
128
-
129
-
130
-
131
-
132
-
133
-
134
-
135
-
136
-
137
-
138
-
139
-
140
-
 141
141 -
 142
142 -
 143
143 -
 144
144 -
 145
145 -
 146
146 -
 147
147 -
 148
148 -
 149
149 -
 150
150 -
 151
151 -
 152
152 -
 153
153 -
 154
154 -
 155
155 -
 156
156 -
 157
157 -
 158
158 -
 159
159 -
 160
160 -
 161
161 -
162
-
163
-
164
-
165
-
166
-
167
-
168
-
169
-
170
-
171
-
172
-
173
-
174
-
175
-
176
-
177
-
178
-
179
-
180
-
181
-
182
-
183
-
184
-
185
-
186
-
187
-
188
-
189
-
190
-
191
-
192
-
193
-
194
-
195
-
196
-
197
-
198
-
199
-
200
-
201
-
202
-
203
-
204
-
205
-
206
-
207
-
208
-
209
-
210
-
211
-
212
-
213
-
214
-
215
-
216
-
217
-
218
-
219
-
220
-
221
-
222
-
223
-
224
-
225
-
226
-
227
-
228
-
229
-
230
-
231
-
232
-
233
-
234
-
235
-
236
-
237
-
238
-
239
-
240
 |
 |

29
Store Portfolio Strategy
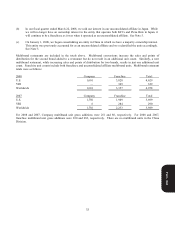
From time to time we sell Company restaurants to existing and new franchisees where geographic synergies can be
obtained or where franchisees’ expertise can generally be leveraged to improve our overall operating performance, while
retaining Company ownership of strategic U.S. and international markets. In the U.S., we are targeting Company
ownership of restaurants potentially below 10% by year end 2010, down from its current level of 19%. Consistent with
this strategy, 700 Company restaurants in the U.S. were sold to franchisees in 2008. We recorded net refranchising losses
of $5 million in the U.S. for the year ended December 27, 2008, primarily due to our refranchising of, or our offers to sell,
certain stores or groups of stores for a price less than their carrying values. We currently anticipate refranchising 500
units in the U.S. in 2009.
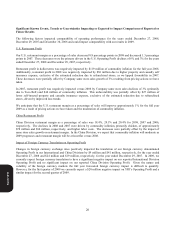
We expect U.S. refranchising will generate the following financial impacts over the three-year period (2008-2010): pre-
tax sales proceeds of about $1 billion, U.S. restaurant margin improvement of about 2.5 percentage points, neutral to
slightly dilutive to U.S. operating profit and net refranchising gains of about $150 million.
While it remains our intent to significantly reduce our ownership levels of Pizza Huts in the U.K. through refranchising,
minimal activity took place in 2008. The timing of future refranchising is currently difficult to predict given refranchising
results to date and the current economic environment.
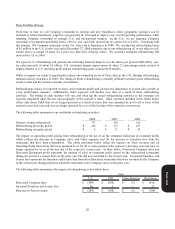
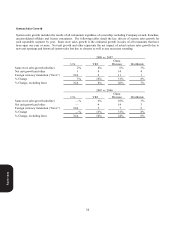
Refranchisings reduce our reported revenues and restaurant profits and increase the importance of system sales growth as
a key performance measure. Additionally, G&A expenses will decline over time as a result of these refranchising
activities. The timing of such declines will vary and often lag the actual refranchising activities as the synergies are
typically dependent upon the size and geography of the respective deals. G&A expenses included in the tables below
reflect only direct G&A that we no longer incurred as a result of stores that were operated by us for all or some of the
respective previous year and were no longer operated by us as of the last day of the respective current year.
The following table summarizes our worldwide refranchising activities:
2008 2007 2006
Number of units refranchised 775 420 62
2
Refranchising proceeds, pretax $ 266 $ 117 $ 25
7
Refranchising net gains, pretax $ 5 $ 11 $ 2
4
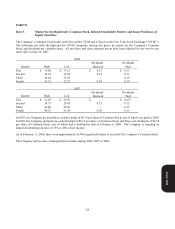
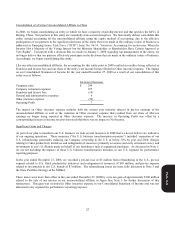
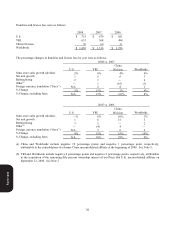
The impact on operating profit arising from refranchising is the net of (a) the estimated reductions in restaurant profit,
which reflects the decrease in Company sales, and G&A expenses and (b) the increase in franchise fees from the
restaurants that have been refranchised. The tables presented below reflect the impacts on Total revenues and on
Operating Profit from stores that were operated by us for all or some portion of the respective previous year and were no
longer operated by us as of the last day of the respective current year. In these tables, Decreased Company sales and
Decreased Restaurant profit represents the amount of sales or restaurant profit earned by the refranchised restaurants
during the period we owned them in the prior year but did not own them in the current year. Increased Franchise and
license fees represents the franchise and license fees from the refranchised restaurants that were recorded by the Company
in the current year during periods in which the restaurants were Company stores in the prior year.
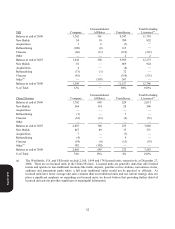
The following table summarizes the impact of refranchising as described above:
2008
U.S. YRI China Division Worldwide
Decreased Company sales $(300) $ (106) $ (5) $
(411)
Increased Franchise and license fees 16 6
—
22
Decrease in Total revenues $(284) $ (100) $ (5) $
(389)
Form 10-K