Pizza Hut 2008 Annual Report Download - page 174
Download and view the complete annual report
Please find page 174 of the 2008 Pizza Hut annual report below. You can navigate through the pages in the report by either clicking on the pages listed below, or by using the keyword search tool below to find specific information within the annual report.
52
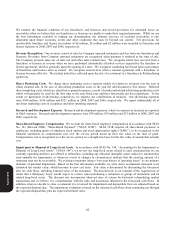
Item 7A. Quantitative and Qualitative Disclosures About Market Risk.
The Company is exposed to financial market risks associated with interest rates, foreign currency exchange rates and
commodity prices. In the normal course of business and in accordance with our policies, we manage these risks through a
variety of strategies, which may include the use of derivative financial and commodity instruments to hedge our
underlying exposures. Our policies prohibit the use of derivative instruments for trading purposes, and we have
procedures in place to monitor and control their use.
Interest Rate Risk
We have a market risk exposure to changes in interest rates, principally in the U.S. We attempt to minimize this risk and
lower our overall borrowing costs through the utilization of derivative financial instruments, primarily interest rate swaps.
These swaps are entered into with financial institutions and have reset dates and critical terms that match those of the
underlying debt. Accordingly, any change in market value associated with interest rate swaps is offset by the opposite
market impact on the related debt.
At December 27, 2008 and December 29, 2007, a hypothetical 100 basis point increase in short-term interest rates would
result, over the following twelve-month period, in a reduction of approximately $9 million and $3 million, respectively, in
income before income taxes. The estimated reductions are based upon the current level of variable rate debt and assume
no changes in the volume or composition of that debt and include no impact from interest income related to cash and cash
equivalents. In addition, the fair value of our derivative financial instruments at December 27, 2008 and December 29,
2007 would decrease approximately $35 million and $31 million, respectively. The fair value of our Senior Unsecured
Notes at December 27, 2008 and December 29, 2007 would decrease approximately $120 million and $173 million,
respectively. Fair value was determined based on the present value of expected future cash flows considering the risks
involved and using discount rates appropriate for the duration.
Foreign Currency Exchange Rate Risk
The combined International Division and China Division Operating Profits constitute approximately 60% of our
Operating Profit in 2008, excluding unallocated income (expenses). In addition, the Company’s net asset exposure
(defined as foreign currency assets less foreign currency liabilities) totaled approximately $2.1 billion as of December 27,
2008. Operating in international markets exposes the Company to movements in foreign currency exchange rates. The
Company’s primary exposures result from our operations in Asia-Pacific, Europe and the Americas. Changes in foreign
currency exchange rates would impact the translation of our investments in foreign operations, the fair value of our
foreign currency denominated financial instruments and our reported foreign currency denominated earnings and cash
flows. For the fiscal year ended December 27, 2008, Operating Profit would have decreased $109 million if all foreign
currencies had uniformly weakened 10% relative to the U.S. dollar. The estimated reduction assumes no changes in sales
volumes or local currency sales or input prices.
We attempt to minimize the exposure related to our investments in foreign operations by financing those investments with
local currency debt when practical. In addition, we attempt to minimize the exposure related to foreign currency
denominated financial instruments by purchasing goods and services from third parties in local currencies when practical.
Consequently, foreign currency denominated financial instruments consist primarily of intercompany short-term
receivables and payables. At times, we utilize forward contracts to reduce our exposure related to these intercompany
short-term receivables and payables. The notional amount and maturity dates of these contracts match those of the
underlying receivables or payables such that our foreign currency exchange risk related to these instruments is minimized.
Commodity Price Risk
We are subject to volatility in food costs as a result of market risk associated with commodity prices. Our ability to
recover increased costs through higher pricing is, at times, limited by the competitive environment in which we operate.
We manage our exposure to this risk primarily through pricing agreements with our vendors.
Form 10-K


