Pizza Hut 2008 Annual Report Download - page 212
Download and view the complete annual report
Please find page 212 of the 2008 Pizza Hut annual report below. You can navigate through the pages in the report by either clicking on the pages listed below, or by using the keyword search tool below to find specific information within the annual report.-
 1
1 -
2
-
3
-
4
-
5
-
6
-
7
-
8
-
9
-
10
-
11
-
12
-
13
-
14
-
15
-
16
-
17
-
18
-
19
-
20
-
21
-
22
-
23
-
24
-
25
-
26
-
27
-
28
-
29
-
30
-
31
-
32
-
33
-
34
-
35
-
36
-
37
-
38
-
39
-
40
-
41
-
42
-
43
-
44
-
45
-
46
-
47
-
48
-
49
-
50
-
51
-
52
-
53
-
54
-
55
-
56
-
57
-
58
-
59
-
60
-
61
-
62
-
63
-
64
-
65
-
66
-
67
-
68
-
69
-
70
-
71
-
72
-
73
-
74
-
75
-
76
-
77
-
78
-
79
-
80
-
81
-
82
-
83
-
84
-
85
-
86
-
87
-
88
-
89
-
90
-
91
-
92
-
93
-
94
-
95
-
96
-
97
-
98
-
99
-
100
-
101
-
102
-
103
-
104
-
105
-
106
-
107
-
108
-
109
-
110
-
111
-
112
-
113
-
114
-
115
-
116
-
117
-
118
-
119
-
120
-
121
-
122
-
123
-
124
-
125
-
126
-
127
-
128
-
129
-
130
-
131
-
132
-
133
-
134
-
135
-
136
-
137
-
138
-
139
-
140
-
141
-
142
-
143
-
144
-
145
-
146
-
147
-
148
-
149
-
150
-
151
-
152
-
153
-
154
-
155
-
156
-
157
-
158
-
159
-
160
-
161
-
162
-
163
-
164
-
165
-
166
-
167
-
168
-
169
-
170
-
171
-
172
-
173
-
174
-
175
-
176
-
177
-
178
-
179
-
180
-
181
-
182
-
183
-
184
-
185
-
186
-
187
-
188
-
189
-
190
-
191
-
192
-
193
-
194
-
195
-
196
-
197
-
198
-
199
-
200
-
201
-
 202
202 -
 203
203 -
 204
204 -
 205
205 -
 206
206 -
 207
207 -
 208
208 -
 209
209 -
 210
210 -
 211
211 -
 212
212 -
 213
213 -
 214
214 -
 215
215 -
 216
216 -
 217
217 -
 218
218 -
 219
219 -
 220
220 -
 221
221 -
 222
222 -
223
-
224
-
225
-
226
-
227
-
228
-
229
-
230
-
231
-
232
-
233
-
234
-
235
-
236
-
237
-
238
-
239
-
240
 |
 |

90
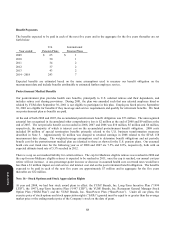
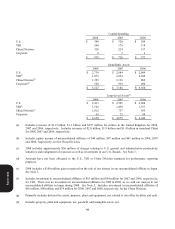
A summary of award activity as of December 27, 2008, and changes during the year then ended is presented below.
Shares
Weighted-Average
Exercise
Price
Weighted-
Average
Remaining
Contractual Ter
m
Aggregate
Intrinsic Value
(in millions)
Outstanding at the beginning of the year 49,137 $ 17.57
Granted 6,533 37.36
Exercised (6,271) 13.49
Forfeited or expired (2,481) 23.58
Outstanding at the end of the year 46,918 $ 20.55 5.45 $ 501
Exercisable at the end of the year 30,060 $ 14.88 4.01 $ 463
The weighted-average grant-date fair value of awards granted during 2008, 2007 and 2006 was $10.91, $8.85 and $8.52,
respectively. The total intrinsic value of stock options and SARs exercised during the years ended December 27, 2008,
December 29, 2007 and December 30, 2006, was $145 million, $238 million and $215 million, respectively.
As of December 27, 2008, there was $107 million of unrecognized compensation cost, which will be reduced by any
forfeitures that occur, related to unvested awards that is expected to be recognized over a weighted-average period of 2.7
years. The total fair value at grant date of awards vested during 2008, 2007 and 2006 was $57 million, $58 million and
$57 million, respectively.
The total compensation expense for stock options and SARs recognized was $51 million, $56 million and $60 million in
2008, 2007 and 2006, respectively. The related tax benefit recognized from this expense was $17 million, $19 million and
$21 million in 2008, 2007 and 2006, respectively.
Cash received from stock options exercises for 2008, 2007 and 2006, was $72 million, $112 million and $142 million,
respectively. Tax benefits realized on our tax returns from tax deductions associated with stock options and SARs
exercised for 2008, 2007 and 2006 totaled $46 million, $76 million and $68 million, respectively.
While historically the Company has repurchased shares on the open market to satisfy award exercises, it does not
currently plan to repurchase shares during 2009.
In January 2008, we granted an award of 187,398 restricted stock units to our Chief Executive Officer (“CEO”). The
award was made under the 1999 LTIP. The award vests after four years and had a market value of $7.0 million as of
January 24, 2008. The award is being expensed over the four year vesting period. The award will be paid to our CEO in
shares of YUM common stock six months following his retirement provided that he does not leave the company before
the award vests. Total expense recorded in 2008 was $2 million.
Form 10-K