Pizza Hut 2008 Annual Report Download - page 171
Download and view the complete annual report
Please find page 171 of the 2008 Pizza Hut annual report below. You can navigate through the pages in the report by either clicking on the pages listed below, or by using the keyword search tool below to find specific information within the annual report.-
 1
1 -
2
-
3
-
4
-
5
-
6
-
7
-
8
-
9
-
10
-
11
-
12
-
13
-
14
-
15
-
16
-
17
-
18
-
19
-
20
-
21
-
22
-
23
-
24
-
25
-
26
-
27
-
28
-
29
-
30
-
31
-
32
-
33
-
34
-
35
-
36
-
37
-
38
-
39
-
40
-
41
-
42
-
43
-
44
-
45
-
46
-
47
-
48
-
49
-
50
-
51
-
52
-
53
-
54
-
55
-
56
-
57
-
58
-
59
-
60
-
61
-
62
-
63
-
64
-
65
-
66
-
67
-
68
-
69
-
70
-
71
-
72
-
73
-
74
-
75
-
76
-
77
-
78
-
79
-
80
-
81
-
82
-
83
-
84
-
85
-
86
-
87
-
88
-
89
-
90
-
91
-
92
-
93
-
94
-
95
-
96
-
97
-
98
-
99
-
100
-
101
-
102
-
103
-
104
-
105
-
106
-
107
-
108
-
109
-
110
-
111
-
112
-
113
-
114
-
115
-
116
-
117
-
118
-
119
-
120
-
121
-
122
-
123
-
124
-
125
-
126
-
127
-
128
-
129
-
130
-
131
-
132
-
133
-
134
-
135
-
136
-
137
-
138
-
139
-
140
-
141
-
142
-
143
-
144
-
145
-
146
-
147
-
148
-
149
-
150
-
151
-
152
-
153
-
154
-
155
-
156
-
157
-
158
-
159
-
160
-
 161
161 -
 162
162 -
 163
163 -
 164
164 -
 165
165 -
 166
166 -
 167
167 -
 168
168 -
 169
169 -
 170
170 -
 171
171 -
 172
172 -
 173
173 -
 174
174 -
 175
175 -
 176
176 -
 177
177 -
 178
178 -
 179
179 -
 180
180 -
 181
181 -
182
-
183
-
184
-
185
-
186
-
187
-
188
-
189
-
190
-
191
-
192
-
193
-
194
-
195
-
196
-
197
-
198
-
199
-
200
-
201
-
202
-
203
-
204
-
205
-
206
-
207
-
208
-
209
-
210
-
211
-
212
-
213
-
214
-
215
-
216
-
217
-
218
-
219
-
220
-
221
-
222
-
223
-
224
-
225
-
226
-
227
-
228
-
229
-
230
-
231
-
232
-
233
-
234
-
235
-
236
-
237
-
238
-
239
-
240
 |
 |

49
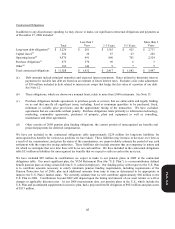
Self-Insured Property and Casualty Losses
We record our best estimate of the remaining cost to settle incurred self-insured property and casualty losses. The
estimate is based on the results of an independent actuarial study and considers historical claim frequency and severity as
well as changes in factors such as our business environment, benefit levels, medical costs and the regulatory environment
that could impact overall self-insurance costs. Additionally, a risk margin to cover unforeseen events that may occur over
the several years it takes for claims to settle is included in our reserve, increasing our confidence level that the recorded
reserve is adequate.
See Note 21 for a further discussion of our insurance programs.
Pension Plans
Certain of our employees are covered under defined benefit pension plans. The most significant of these plans are in the
U.S. We have recorded the under-funded status of $410 million for these U.S. plans as a pension liability in our
Consolidated Balance Sheet as of December 27, 2008. These U.S. plans had a projected benefit obligation (“PBO”) of
$923 million and a fair value of plan assets of $513 million at December 27, 2008.
The PBO reflects the actuarial present value of all benefits earned to date by employees and incorporates assumptions as
to future compensation levels. Due to the relatively long time frame over which benefits earned to date are expected to be
paid, our PBO’s are highly sensitive to changes in discount rates. For our U.S. plans, we measured our PBO using a
discount rate of 6.5% at December 27, 2008. This discount rate was determined with the assistance of our independent
actuary. The primary basis for our discount rate determination is a model that consists of a hypothetical portfolio of ten or
more corporate debt instruments rated Aa or higher by Moody’s with cash flows that mirror our expected benefit payment
cash flows under the plans. We excluded from the model those corporate debt instruments flagged by Moody’s for a
potential downgrade and bonds with yields that were two standard deviations or more above the mean. In considering
possible bond portfolios, the model allows the bond cash flows for a particular year to exceed the expected benefit cash
flows for that year. Such excesses are assumed to be reinvested at appropriate one-year forward rates and used to meet
the benefit cash flows in a future year. The weighted average yield of this hypothetical portfolio was used to arrive at an
appropriate discount rate. We also insure that changes in the discount rate as compared to the prior year are consistent
with the overall change in prevailing market rates and make adjustments as necessary. A 50 basis point increase in this
discount rate would have decreased our U.S. plans’ PBO by approximately $64 million at our measurement date.
Conversely, a 50 basis point decrease in this discount rate would have increased our U.S. plans’ PBO by approximately
$74 million at our measurement dates.
The pension expense we will record in 2009 is also impacted by the discount rate we selected at our measurement date.
We expect pension expense for our U.S. plans to increase approximately $3 million to $39 million in 2009. The increase
is primarily driven by an increase in amortization of net loss. A 50 basis point change in our discount rate assumption at
our measurement date would impact our 2009 U.S. pension expense by approximately $12 million.
The assumption we make regarding our expected long-term rates of return on plan assets also impacts our pension
expense. Our estimated long-term rate of return on U.S. plan assets represents the weighted-average of historical returns
for each asset category, adjusted for an assessment of current market conditions. Our expected long-term rate of return on
U.S. plan assets at December 27, 2008 was 8.0%. We believe this rate is appropriate given the composition of our plan
assets and historical market returns thereon. A one percentage point increase or decrease in our expected long-term rate of
return on plan assets assumption would decrease or increase, respectively, our 2009 U.S. pension plan expense by
approximately $7 million.
Form 10-K