Pizza Hut 2008 Annual Report Download - page 146
Download and view the complete annual report
Please find page 146 of the 2008 Pizza Hut annual report below. You can navigate through the pages in the report by either clicking on the pages listed below, or by using the keyword search tool below to find specific information within the annual report.-
 1
1 -
2
-
3
-
4
-
5
-
6
-
7
-
8
-
9
-
10
-
11
-
12
-
13
-
14
-
15
-
16
-
17
-
18
-
19
-
20
-
21
-
22
-
23
-
24
-
25
-
26
-
27
-
28
-
29
-
30
-
31
-
32
-
33
-
34
-
35
-
36
-
37
-
38
-
39
-
40
-
41
-
42
-
43
-
44
-
45
-
46
-
47
-
48
-
49
-
50
-
51
-
52
-
53
-
54
-
55
-
56
-
57
-
58
-
59
-
60
-
61
-
62
-
63
-
64
-
65
-
66
-
67
-
68
-
69
-
70
-
71
-
72
-
73
-
74
-
75
-
76
-
77
-
78
-
79
-
80
-
81
-
82
-
83
-
84
-
85
-
86
-
87
-
88
-
89
-
90
-
91
-
92
-
93
-
94
-
95
-
96
-
97
-
98
-
99
-
100
-
101
-
102
-
103
-
104
-
105
-
106
-
107
-
108
-
109
-
110
-
111
-
112
-
113
-
114
-
115
-
116
-
117
-
118
-
119
-
120
-
121
-
122
-
123
-
124
-
125
-
126
-
127
-
128
-
129
-
130
-
131
-
132
-
133
-
134
-
135
-
 136
136 -
 137
137 -
 138
138 -
 139
139 -
 140
140 -
 141
141 -
 142
142 -
 143
143 -
 144
144 -
 145
145 -
 146
146 -
 147
147 -
 148
148 -
 149
149 -
 150
150 -
 151
151 -
 152
152 -
 153
153 -
 154
154 -
 155
155 -
 156
156 -
157
-
158
-
159
-
160
-
161
-
162
-
163
-
164
-
165
-
166
-
167
-
168
-
169
-
170
-
171
-
172
-
173
-
174
-
175
-
176
-
177
-
178
-
179
-
180
-
181
-
182
-
183
-
184
-
185
-
186
-
187
-
188
-
189
-
190
-
191
-
192
-
193
-
194
-
195
-
196
-
197
-
198
-
199
-
200
-
201
-
202
-
203
-
204
-
205
-
206
-
207
-
208
-
209
-
210
-
211
-
212
-
213
-
214
-
215
-
216
-
217
-
218
-
219
-
220
-
221
-
222
-
223
-
224
-
225
-
226
-
227
-
228
-
229
-
230
-
231
-
232
-
233
-
234
-
235
-
236
-
237
-
238
-
239
-
240
 |
 |

24
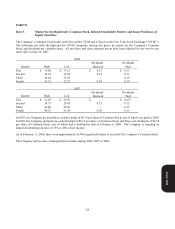
Item 7. Management’s Discussion and Analysis of Financial Condition and Results of Operations.
Introduction and Overview
The following Management’s Discussion and Analysis (“MD&A”), should be read in conjunction with the Consolidated
Financial Statements on pages 56 through 59 (“Financial Statements”) and the Forward-Looking Statements on page 2
and the Risk Factors set forth in Item 1A. Throughout the MD&A, YUM! Brands, Inc. (“YUM” or the “Company”)
makes reference to certain performance measures as described below.
•The Company provides the percentage changes excluding the impact of foreign currency translation. These amounts
are derived by translating current year results at prior year average exchange rates. We believe the elimination of the
foreign currency translation impact provides better year-to-year comparability without the distortion of foreign
currency fluctuations.
• System sales growth includes the results of all restaurants regardless of ownership, including Company-owned,
franchise, unconsolidated affiliate and license restaurants. Sales of franchise, unconsolidated affiliate and license
restaurants generate franchise and license fees for the Company (typically at a rate of 4% to 6% of sales). Franchise,
unconsolidated affiliate and license restaurant sales are not included in Company sales on the Consolidated
Statements of Income; however, the franchise and license fees are included in the Company’s revenues. We believe
system sales growth is useful to investors as a significant indicator of the overall strength of our business as it
incorporates all of our revenue drivers, Company and franchise same store sales as well as net unit development.
• Same store sales is the estimated growth in sales of all restaurants that have been open one year or more.
• Company restaurant margin as a percentage of sales is defined as Company sales less expenses incurred directly by
our Company restaurants in generating Company sales divided by Company sales.
• Operating margin is defined as Operating Profit divided by Total revenue.
All Note references herein refer to the Notes to the Financial Statements on pages 60 through 106. Tabular amounts are
displayed in millions except per share and unit count amounts, or as otherwise specifically identified. All per share and
share amounts herein, and in the accompanying Financial Statements and Notes to the Financial Statements have been
adjusted to reflect the June 26, 2007 stock split (see Note 3).
Description of Business
YUM is the world’s largest restaurant company in terms of system restaurants with over 36,000 restaurants in more than
110 countries and territories operating under the KFC, Pizza Hut, Taco Bell, Long John Silver’s or A&W All-American
Food Restaurants brands. Four of the Company’s restaurant brands – KFC, Pizza Hut, Taco Bell and Long John Silver’s
– are the global leaders in the chicken, pizza, Mexican-style food and quick-service seafood categories, respectively. Of
the over 36,000 restaurants, 21% are operated by the Company, 73% are operated by franchisees and unconsolidated
affiliates and 6% are operated by licensees.
YUM’s business consists of three reporting segments: United States, YUM Restaurants International (“YRI” or
“International Division”) and the China Division. The China Division includes mainland China (“China”), Thailand and
KFC Taiwan and YRI includes the remainder of our international operations. The China Division and YRI have been
experiencing dramatic growth and now represent nearly 60% of the Company’s operating profits. The U.S. business
operates in a highly competitive marketplace resulting in slower profit growth, but continues to produce strong cash flows.
Form 10-K