Pizza Hut 2008 Annual Report Download - page 12
Download and view the complete annual report
Please find page 12 of the 2008 Pizza Hut annual report below. You can navigate through the pages in the report by either clicking on the pages listed below, or by using the keyword search tool below to find specific information within the annual report.-
 1
1 -
 2
2 -
 3
3 -
 4
4 -
 5
5 -
 6
6 -
 7
7 -
 8
8 -
 9
9 -
 10
10 -
 11
11 -
 12
12 -
 13
13 -
 14
14 -
 15
15 -
 16
16 -
 17
17 -
 18
18 -
 19
19 -
 20
20 -
 21
21 -
 22
22 -
23
-
24
-
25
-
26
-
27
-
28
-
29
-
30
-
31
-
32
-
33
-
34
-
35
-
36
-
37
-
38
-
39
-
40
-
41
-
42
-
43
-
44
-
45
-
46
-
47
-
48
-
49
-
50
-
51
-
52
-
53
-
54
-
55
-
56
-
57
-
58
-
59
-
60
-
61
-
62
-
63
-
64
-
65
-
66
-
67
-
68
-
69
-
70
-
71
-
72
-
73
-
74
-
75
-
76
-
77
-
78
-
79
-
80
-
81
-
82
-
83
-
84
-
85
-
86
-
87
-
88
-
89
-
90
-
91
-
92
-
93
-
94
-
95
-
96
-
97
-
98
-
99
-
100
-
101
-
102
-
103
-
104
-
105
-
106
-
107
-
108
-
109
-
110
-
111
-
112
-
113
-
114
-
115
-
116
-
117
-
118
-
119
-
120
-
121
-
122
-
123
-
124
-
125
-
126
-
127
-
128
-
129
-
130
-
131
-
132
-
133
-
134
-
135
-
136
-
137
-
138
-
139
-
140
-
141
-
142
-
143
-
144
-
145
-
146
-
147
-
148
-
149
-
150
-
151
-
152
-
153
-
154
-
155
-
156
-
157
-
158
-
159
-
160
-
161
-
162
-
163
-
164
-
165
-
166
-
167
-
168
-
169
-
170
-
171
-
172
-
173
-
174
-
175
-
176
-
177
-
178
-
179
-
180
-
181
-
182
-
183
-
184
-
185
-
186
-
187
-
188
-
189
-
190
-
191
-
192
-
193
-
194
-
195
-
196
-
197
-
198
-
199
-
200
-
201
-
202
-
203
-
204
-
205
-
206
-
207
-
208
-
209
-
210
-
211
-
212
-
213
-
214
-
215
-
216
-
217
-
218
-
219
-
220
-
221
-
222
-
223
-
224
-
225
-
226
-
227
-
228
-
229
-
230
-
231
-
232
-
233
-
234
-
235
-
236
-
237
-
238
-
239
-
240
 |
 |
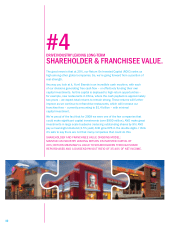
#4
drive indUstry leading long-term
sHareHolder & FrancHisee valUe.
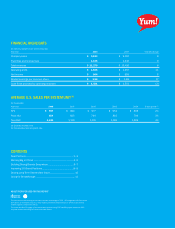
The good news is that at 20%, our Return On Invested Capital (ROIC) ranks us
high among other global companies. So, we’re going forward from a position of
real strength.
Any way you look at it, Yum! Brands is an incredible cash machine, with each
of our divisions generating free cash ow – or effectively funding their own
capital investments. As this capital is deployed to high-return opportunities –
for example, new restaurants in China, where the cash payback is approximately
two years – we expect total returns to remain strong. These returns will further
improve as we continue to refranchise restaurants, which will increase our
franchise fees – currently amounting to $1.4 billion – with minimal
capital investment.
We’re proud of the fact that for 2008 we were one of the few companies that
could make signicant capital investments (over $900 million), AND make great
investments in large scale buybacks (reducing outstanding shares by 9%) AND
pay a meaningful dividend (2.5% yield) AND grow EPS in the double digits. I think
it’s safe to say there are not that many companies that could do this.
SHAREHOLDER AND FRANCHISEE VALUE ONGOING MODEL:
MAINTAIN AN INDUSTRY LEADING RETURN ON INVESTED CAPITAL OF
20%; RETURN MEANINGFUL VALUE TO SHAREHOLDERS THROUGH SHARE
REPURCHASES AND A DIVIDEND PAY-OUT RATIO OF 35-40% OF NET INCOME.
10